
This document is intended to give users detail on when and how to use event detection. It may be useful to some extent to many users, but is aimed at the plant engineer persona and therefore has more detailed, technical oriented descriptions. Its intention is to help maintain the transparency of the Trend Forecasting feature so that a sophisticated user understands precisely what they are doing during this step of the forecast configuration.
Event detection is optional in Trend Forecasting so does not need to be configured and in fact may not be helpful for some signals. However, if your signal has events that cause changes or discontinuities in the data, using data prior to the event for fitting the model will result in inaccurate forecasts:
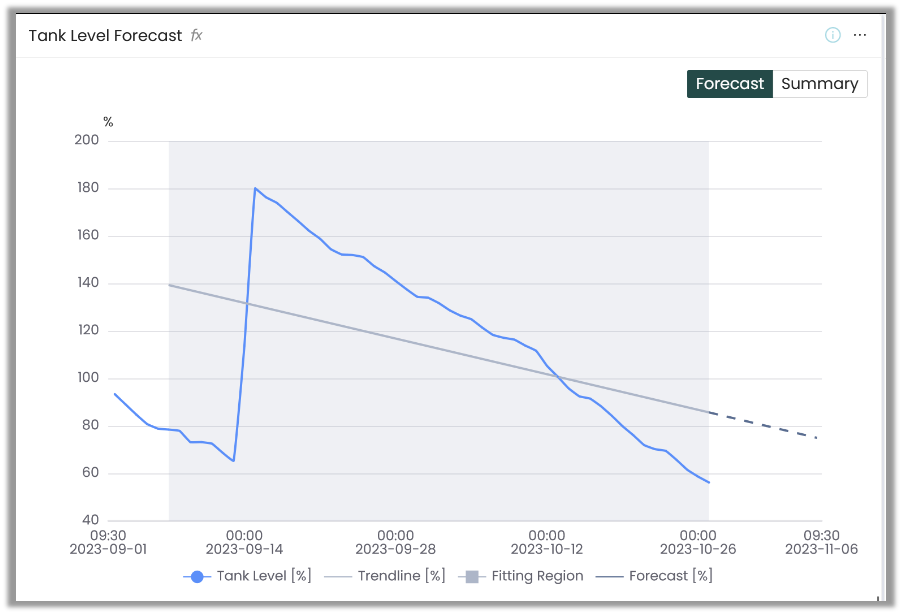
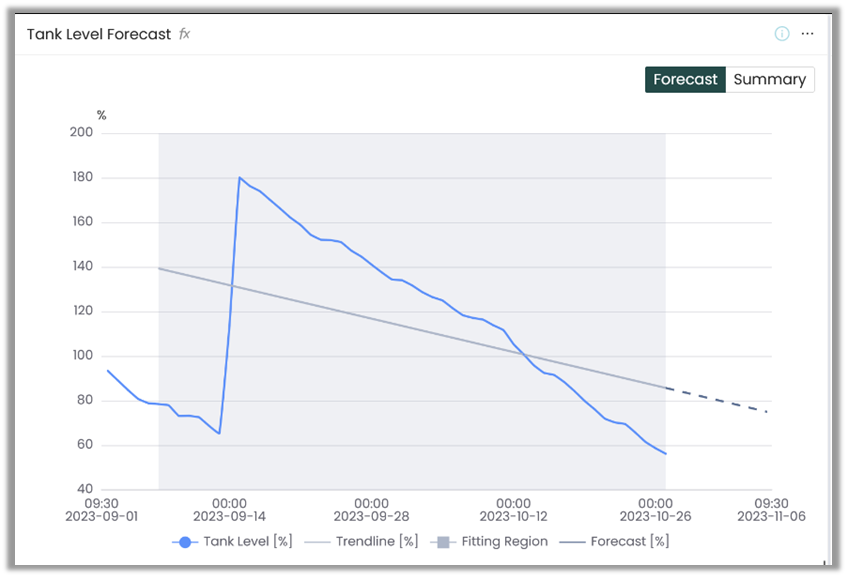
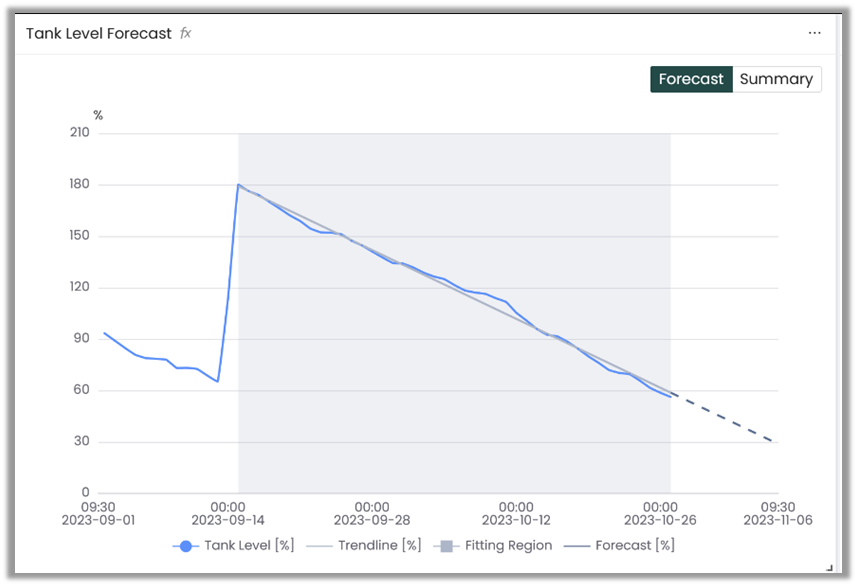
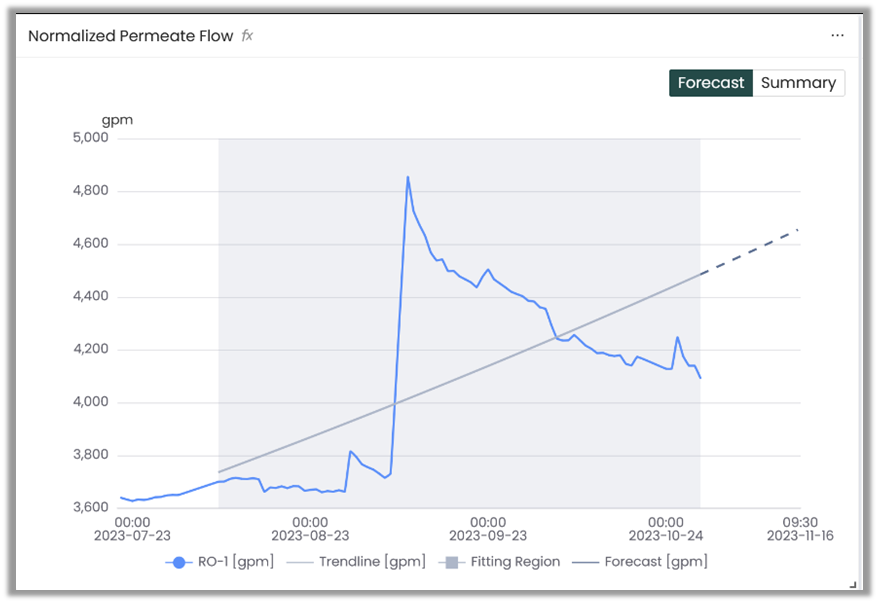
As can be seen from the shaded fitting region, data points before the refill event are being used to fit the linear model resulting in it having a significantly different slope from the recent data.
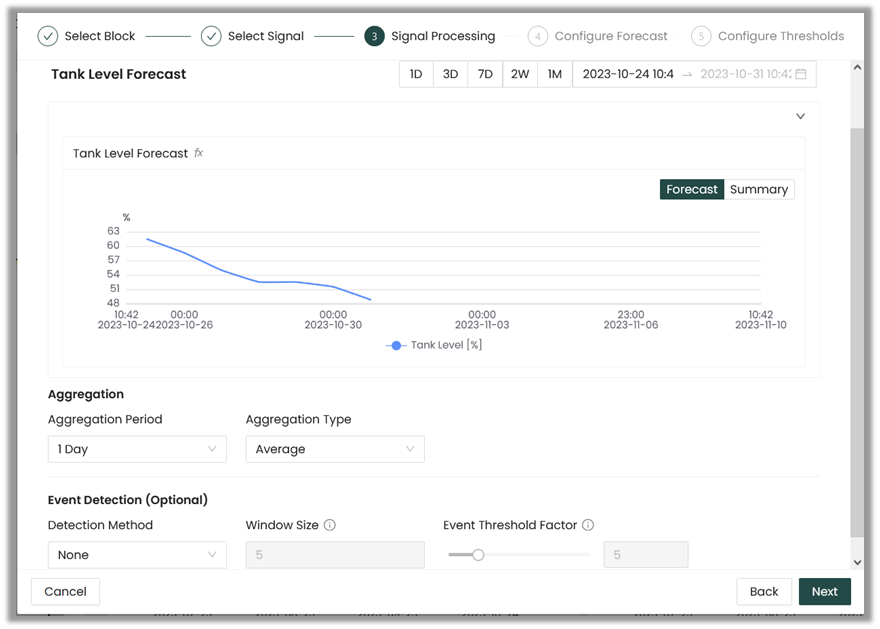
Event detection in Trend Forecasting allows the forecasting model to know when an event has occurred so that it only uses relevant data for fitting the model. The forecasting model will only use data after the most recent event for fitting. This is the same signal and forecast configuration as above with event detection configured:

Event detection will only look at data for the signal that is being forecast. Therefore, the signal itself must clearly reflect the fact that an event has occurred in order for it to be detected.
If there is insufficient data to fit the model after the most recent detected event, a warning will be provided and no forecast will be produced.
How Events are Detected: Step Detection Method
The Step Detection method is intended for signals that see a distinct step change in values such as tank refills. It will detect these changes as events.
Configurable parameters:
- Window Size
- Event Threshold Factor
- Preview Window Date Range
The Step Detection algorithm works by:
- Taking the rolling median using the Window Size as the rolling window. This helps to smooth the data, remove outliers and ensure that only sustained changes are detected as events.
- Calculating the absolute value of the difference between each consecutive point.
- Setting the threshold to detect events as 3Q+c*IQR where 3Q is the 75th percentile of the absolute value of differences calculated in step 2, c is the Event Threshold Factor and IQR is the interquartile range: 75th percentile - 25th percentile.
- The Preview Window Date Range selected sets how much data event detection will use to calculate these statistics. This is saved as a sliding window meaning that, for example, if the date range is set to show the past 30 days, future forecasts will calculate these statistics from the most recent 30 days of data at the time of calculation.
- Events are classified as any points who's absolute difference calculated in step 2 is greater than this threshold.
This method does not work well for:
- events that cause changes in the trend, but not jumps in the data
- events that cause gradual changes over a long time horizon
- data with noise of a similar magnitude to event changes
- try different aggregation options to help smooth the data
Event detection is intended to be used by iteratively adjusting parameters until the results are as expected, rather than determining the optimal parameters analytically.
To configure event detection, it's recommended to use a Preview Window Date Range that is large enough to capture at least 2-3 events if possible. This means that for infrequent events, a larger date range will be needed. Note that a larger date range increases the amount of data used and therefore will result in longer computation times when adjusting configuration. Increasing aggregation periods can help mitigate this.
Once this window is selected, adjust the event detection parameters until the events are properly detected. It is fine to detect multiple points for a given event, so long as false events aren't being detected elsewhere in the data.
See the Examples section below for a detailed walkthrough with some sample signals.
What to Do if Events Aren't Detected?
If adjusting the event detection parameters doesn't result in proper detection, try adjusting the aggregation type and period so that the events appear more clearly in the processed data.
If the events are still not able to be detected, then the forecast will need to be monitored more closely and its configuration manually adjusted as required. The fitting error, warnings and a visual inspection of the trend and it's fitting period will give an indication of when a forecast needs adjusting. The fitting period can be manually changed to avoid fitting across events.
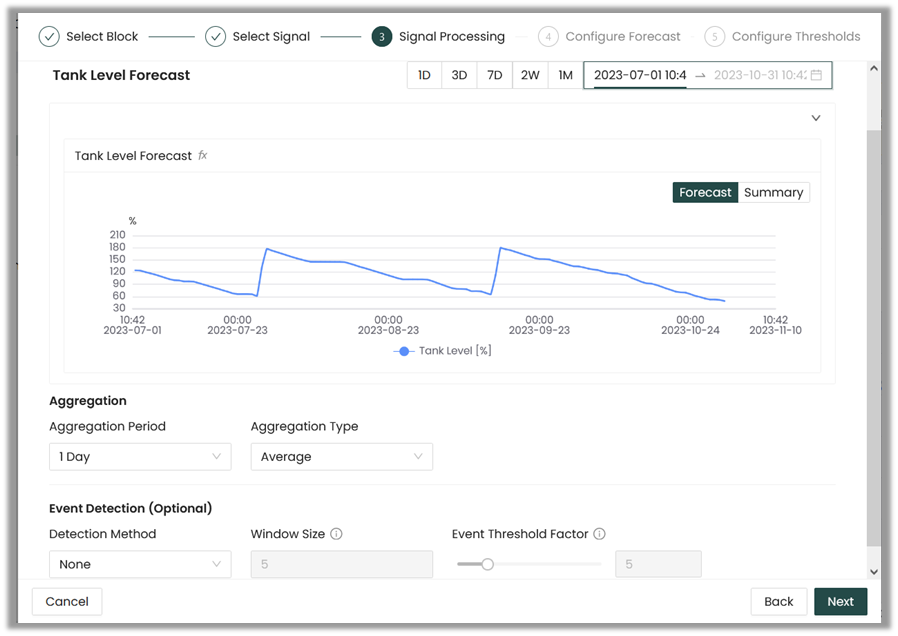
Chemical Tank Level
Forecast without event detection:
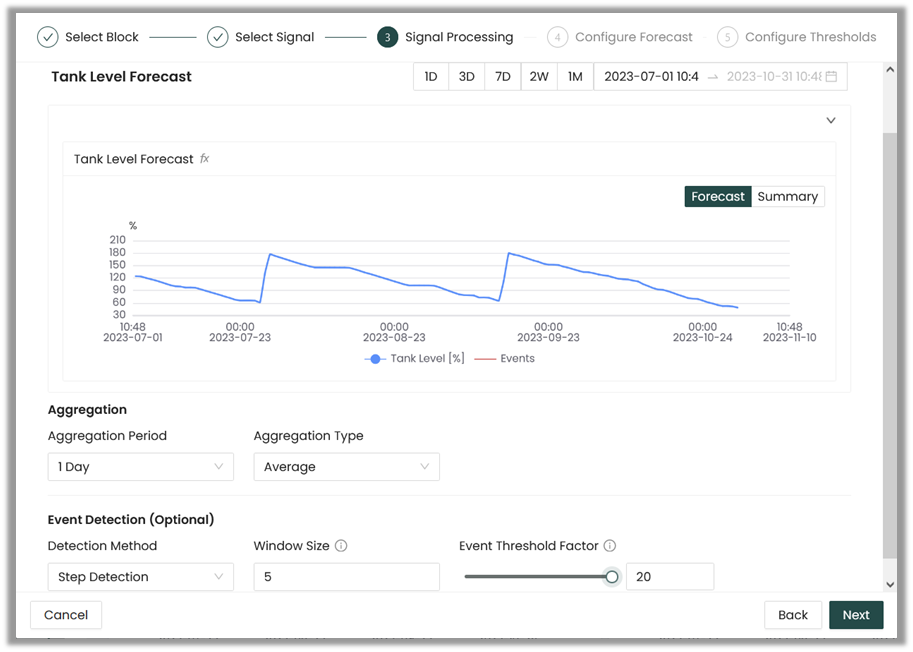
Event detection configuration:
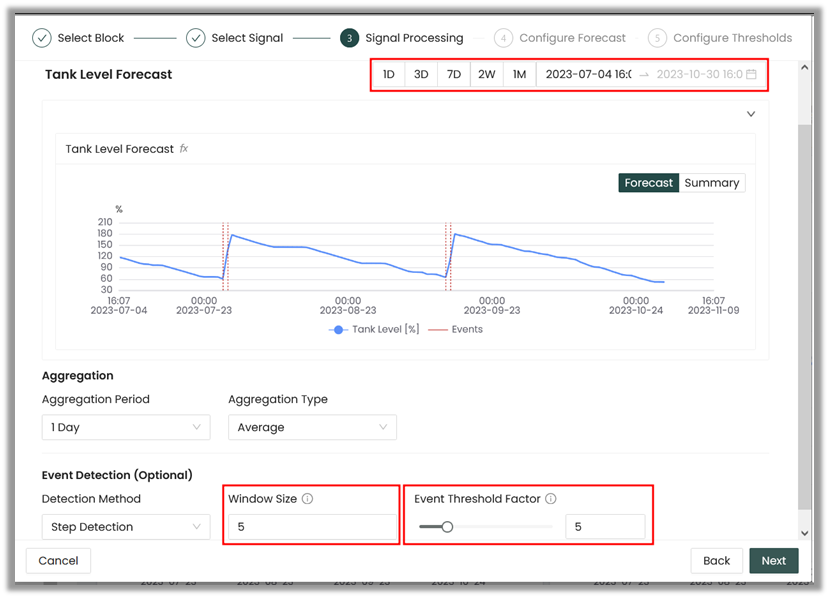
First, select an appropriate Preview Window Date Range so that 2-3 events can be seen.
Then, select a Detection Method and adjust the Window Size and Event Threshold Factor. In this example, the Event Threshold Factor is too high and no events are being detected:
With a smaller Event Threshold Factor, events are being detected properly:
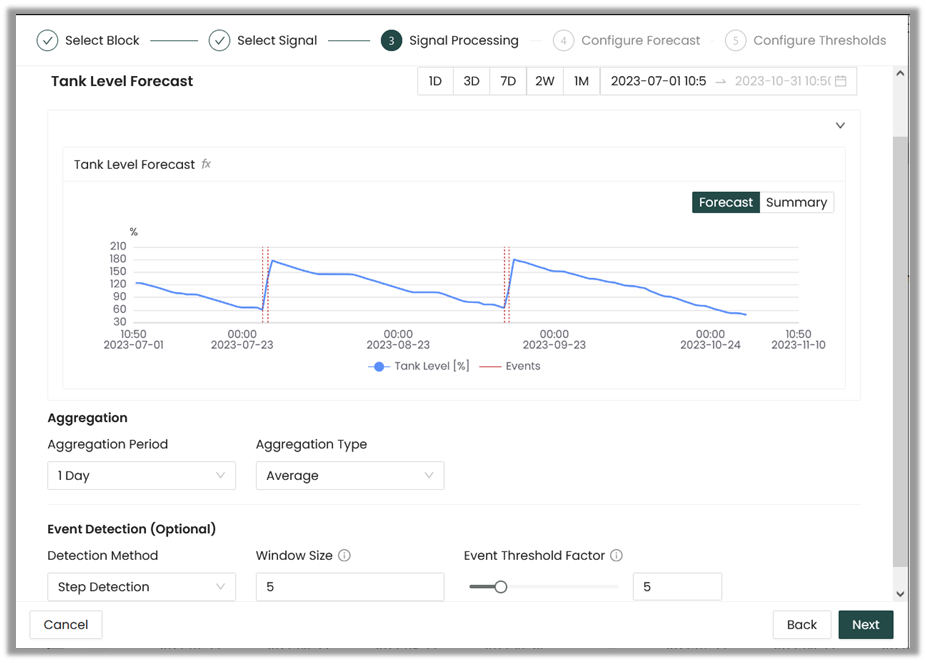
Note that multiple events are detected at each tank refill. This is perfectly fine for this signal and the forecast will perform as expected.
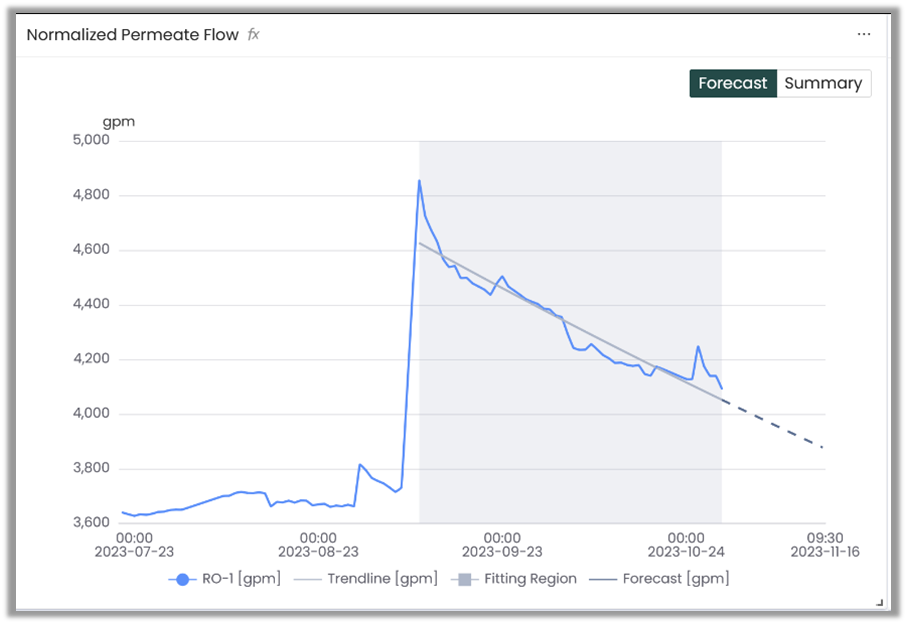
Forecast with event detection:
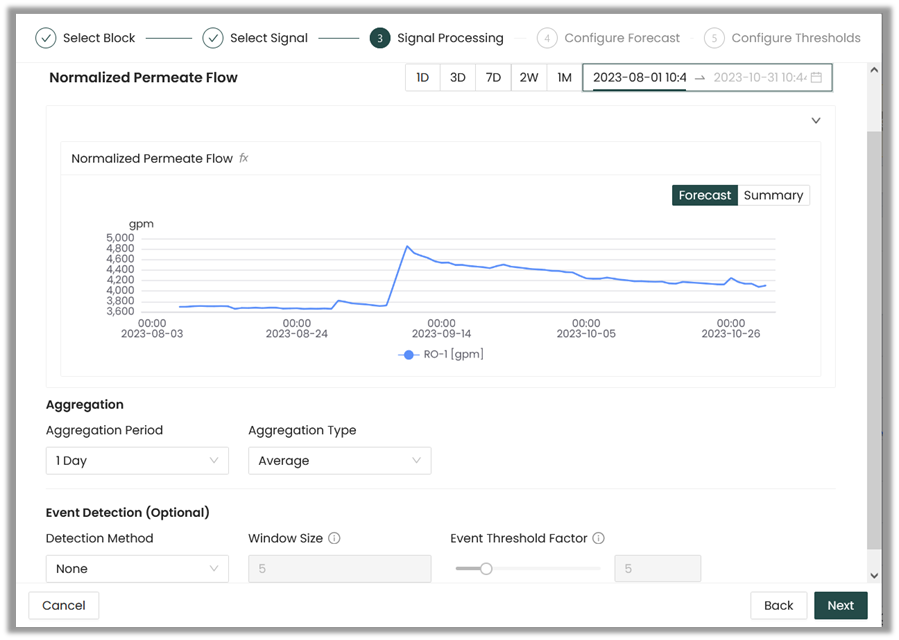
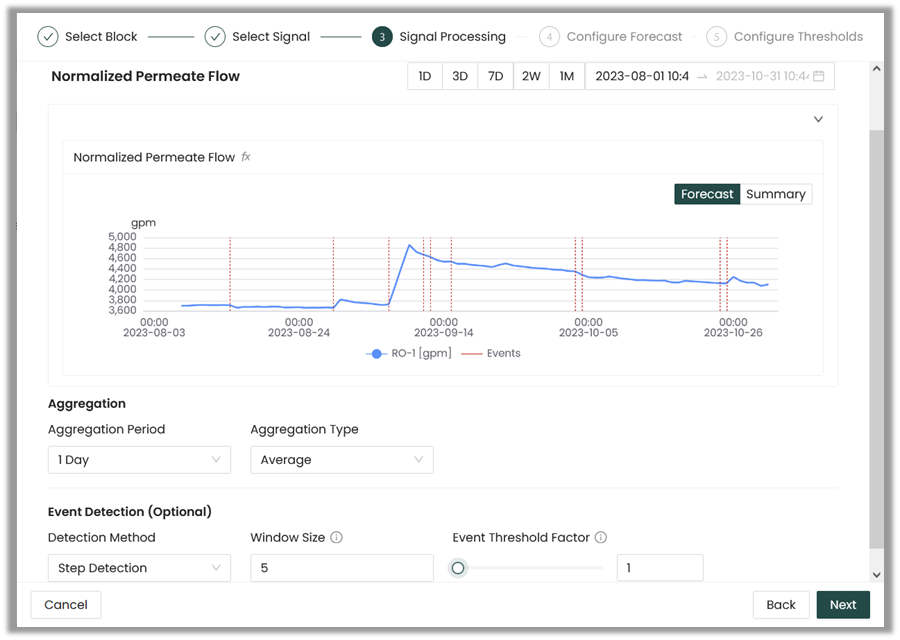
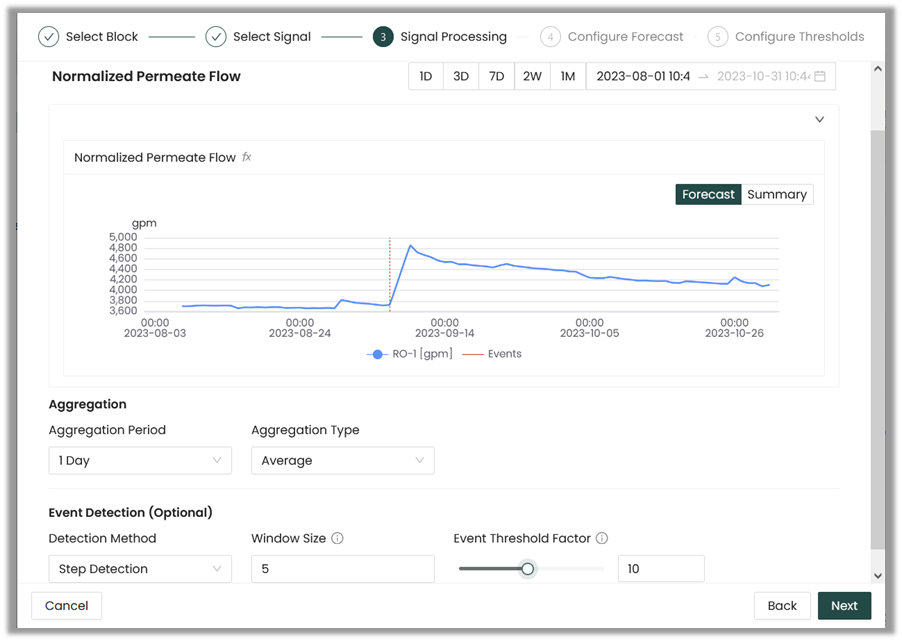
Reverse Osmosis Train Normalized Permeate Flow
Forecast without event detection:
Event detection configuration:
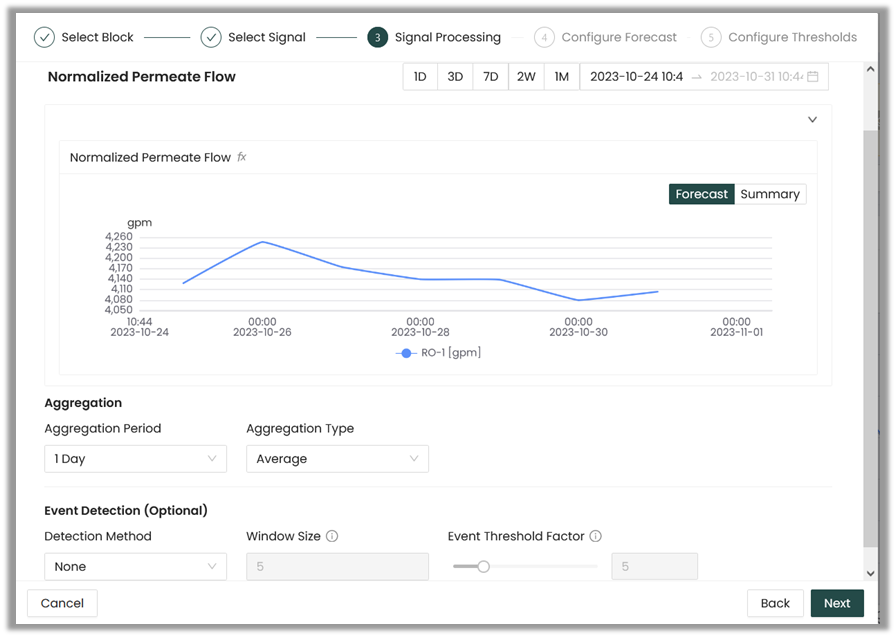
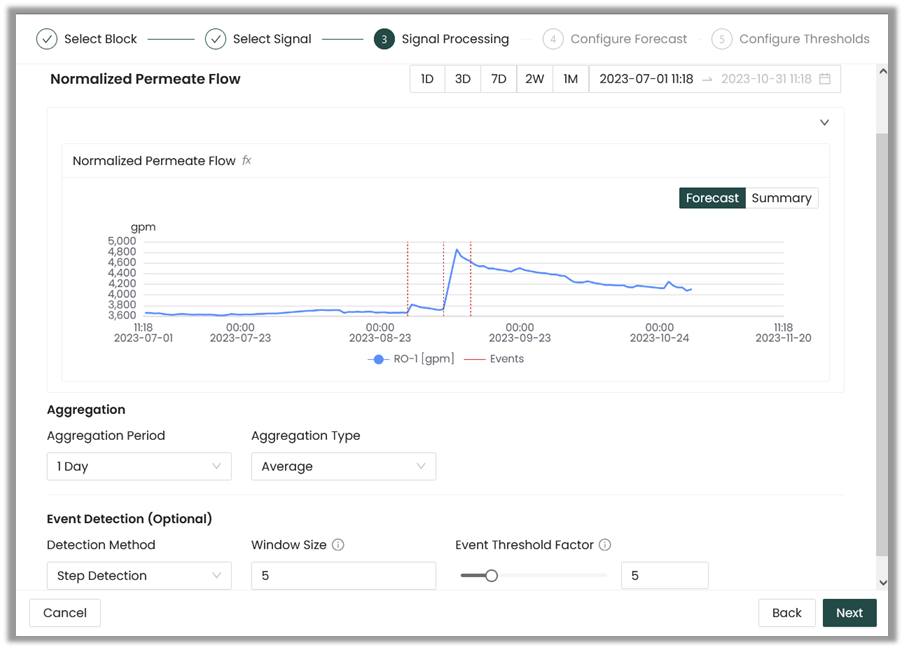
First, select an appropriate Preview Window Date Range. Ideally this would be such that that 2-3 events can be seen, but in this example there is only one event in the historical data available. So long as the time period is representative of how often an event is likely to occur, this is acceptable.
Next, select a Detection Method and adjust the Window Size and Event Threshold Factor. In this example, the Event Threshold Factor is too low and false positive events are being detected:
With a larger Event Threshold Factor, only the actual event is being detected as desired:
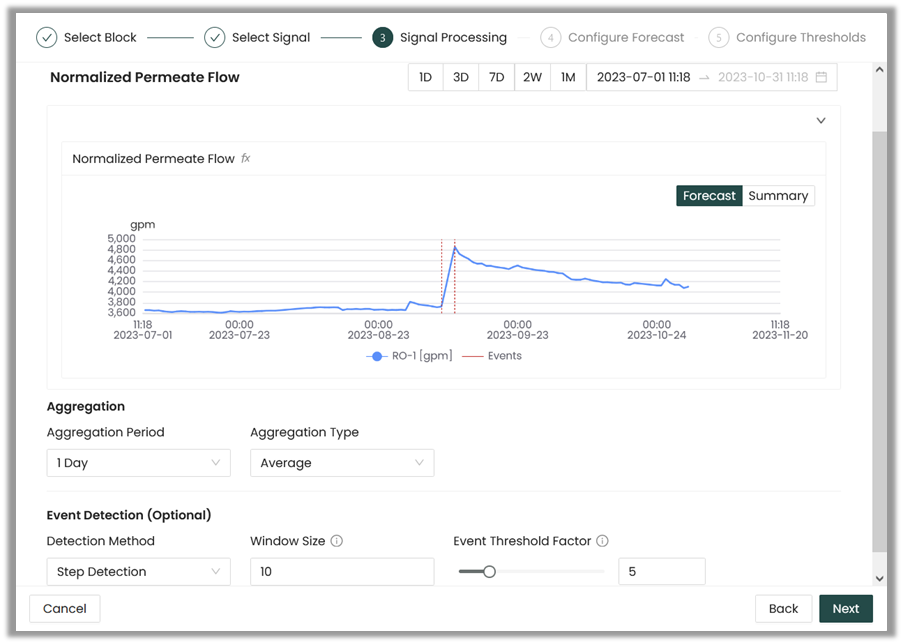
Alternatively, changing first the Event Threshold Factor to a more moderate value:
and then also adjusting the Window Size will result in similar event detection:
Note that multiple events are detected. This is perfectly fine for this signal and the forecast will perform as expected.
Forecast with event detection:
Event detection in trend forecasting will improve the accuracy of your forecasts when your data contains events that cause significant changes or discontinuities. Without event detection, using data prior to these events for model fitting can lead to inaccurate forecasts because the model may not account for the impact of these events. By identifying and incorporating event information into your forecasting process, you can make more reliable predictions that consider the effects of these important occurrences.

