

Introduction
The Overview page is where data is visualized and presented for analysis and action. In Overview, users have access to pre-built dashboards called Views, and have the option to create personalized or customized Views as well. A View consists of one or more blocks - graphs, charts, etc - whose function is to display data from sensors or KPIs. The blocks are fully configurable, customizable, and designed to display current conditions and historical trends. This article is a snippet, focused on organizing and editing Views, taken from the full Overview Page article here.
Organizing Views
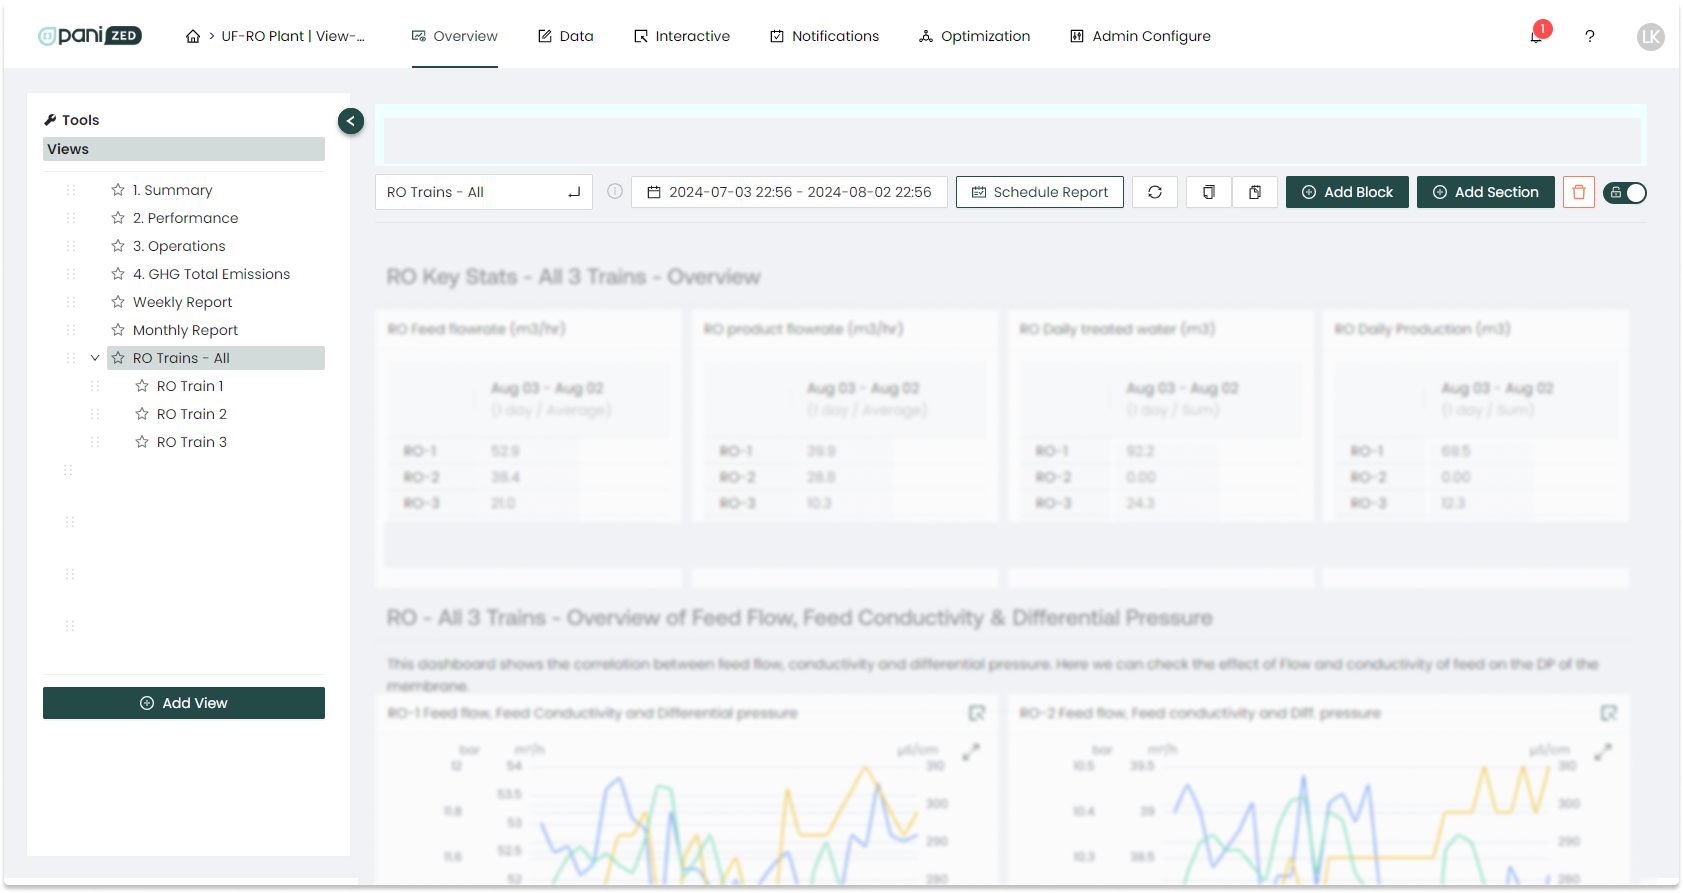
You can organize Views a variety of ways. All Views are listed in the left side menu within the platform. Views can be hidden or shown, indicated by an eye icon. Within each View, blocks have a variety of customization options when being built, arranged, sized, organized and edited. The image below shows an example of a list of Views along the left, and in this case, a 'parent' View built to show metrics for three reverse osmosis trains, with nested Views for each individual train.
Organizing Views in the left menu
Once you've created a View, you can name and choose the order it appears in the left side menu.
- Manually drag and drop to move Views into the order you'd like them to appear
- previously put into alphabetical order by default, now can be arbitrary
- previously put into alphabetical order by default, now can be arbitrary
- Nesting hierarchy means you can make Views 'parents' or 'children' or 'siblings' of other Views
- Simply drag and drop according to the underline that will appear to indicate new placement
- Simply drag and drop according to the underline that will appear to indicate new placement
- Newly created/added views will appear to the bottom of the list
- these will default as a 'sibling' (without any 'parents')
- these will default as a 'sibling' (without any 'parents')
- Name and rename Views as you like
- The title update box is always in "edit" mode
- Simply click into the title box, press enter to submit changes, and click away to reset
![]()
Organizing View blocks
Once the block is built and appears within the dashboard View, it can be moved or resized as desired on the screen.
- To move the block, click and hold the blank space in the header bar beside the name and drag to the desired location on the page.
- To resize the block, click and hold the
 right angle icon in the lower right corner of the block, activating the resize cursor, then drag to and release at the desired size.
- To organize a group of blocks into clearly grouped and labeled sections, unlock the View, then the
 "Add Section" button in the upper right part of the screen will become active.
- This will add a full-width title and description text block that you can place as a horizontal break and adjust the height as desired.
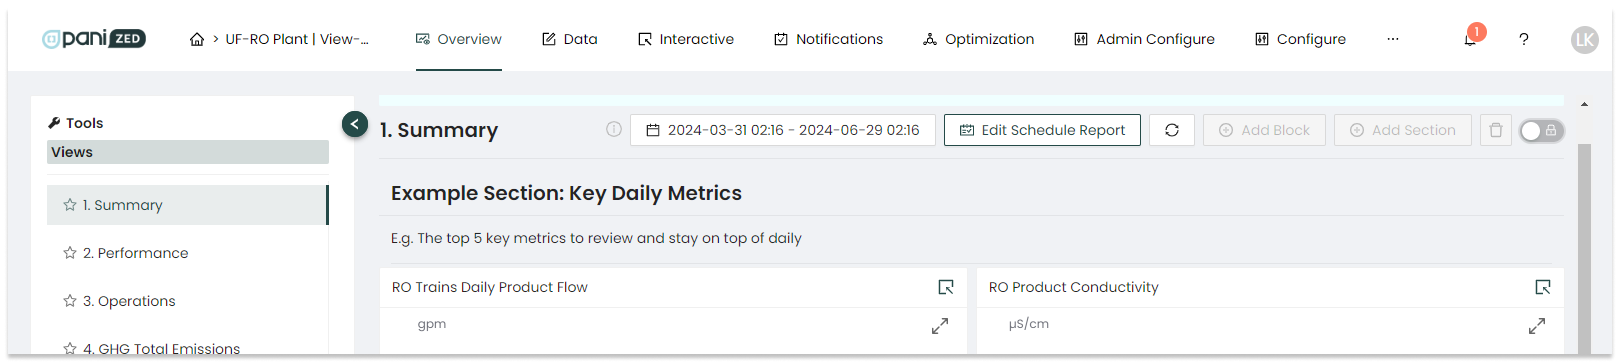
- This will add a full-width title and description text block that you can place as a horizontal break and adjust the height as desired.
Editing Views
You can edit Views at any time.
To edit a View:
- Within the desired View, click the lock/unlock slider switch in the upper right to move from the locked position
 to the unlocked position
  to allow editing.
 - Once unlocked and editing is enabled, select the pencil icon
 in the upper right corner of the block to make it editable.
 - You can also duplicate with the
 double-pages icon, or delete with the
  red trash bin icon.
Using Views to create dashboards is a great way of presenting information to specific users. Create a View for senior managers, for PAs, or specific operator actions. You can also use Views to create weekly or monthly performance report. Screen capture and email Views to executives as a quick weekly update. There are lots of uses, and the breadth and depth of the Overview reports allows you to visualize plant data in many ways.

