Trend Forecasting is a tool that allows engineers to set up data forecast "blocks" (predictions into the future) within a given View, within the Overview tab of Pani Zed. This article includes information on how to create a Trend Forecast and how to interpret the results.
Creating a Forecast
You can create Trend Forecast blocks in Overview. There are 5 steps to create a Trend forecast:
To create a forecast, click on one of the views in Overview and click on the unlock icon. Then 'Add Block'. The pop-up window will display charting options, click on Trend Forecast.
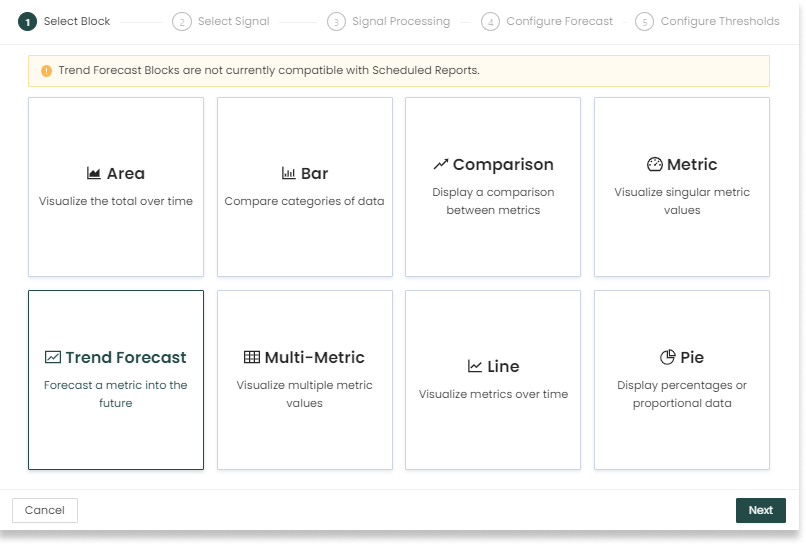
Fig. 1 Overview - View - Add Block initial window, showing all block options, with Trend Forecast option selected.
The next step is to select the signal of interest for the forecast. The date picker can be used to change the date range shown in the preview window and help identify the correct fitting period.
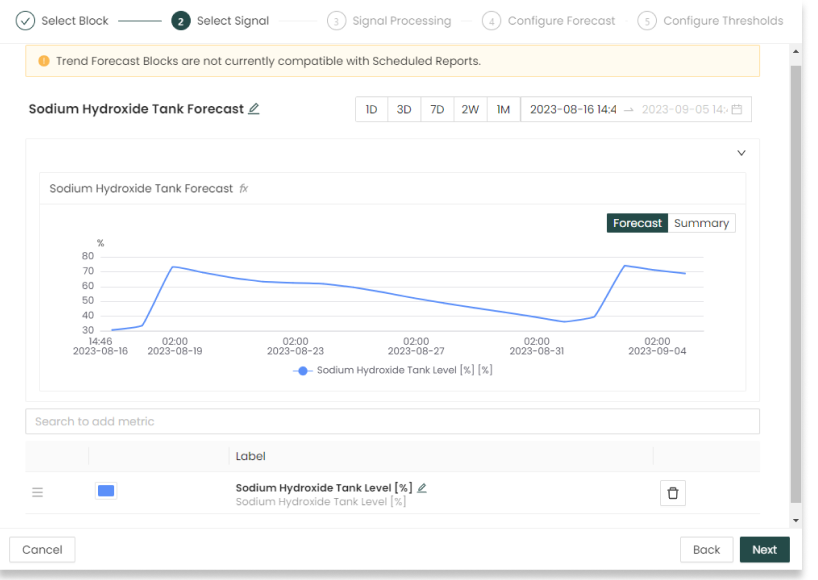
Fig. 2. Trend Forecasting block window for Step 2 to select signal.
Next, configure the signal processing. Processing the signal can allow for a more accurate fit of the forecasting model. The configuration can easily be modified and re-iterated upon seeing previews of the forecast. Signal processing options include:
- Aggregation Period and Aggregation Type transform the frequency of the signal.
- For example, performing a 1-day average. If the 'raw' option is selected for the Aggregation Type, then the signal will not be transformed, and the Aggregation Period field will be greyed out.
- (Optional) Event Detection ensures that the forecast will only fit to data after the most recent detected event.
- Detection Method is the method used to detect events. One of these options must be selected to use event detection for the forecast, otherwise it should left as None.
- Window Size is the number of points per window used by the event detection, after aggregating the data as configured above. Larger windows can decrease the number of events detected while smaller numbers will lead to more detected events.
- Event Threshold Factor helps determine how significant an event must be to be detected. Increase this number to detect fewer events and decrease it to detect more events.
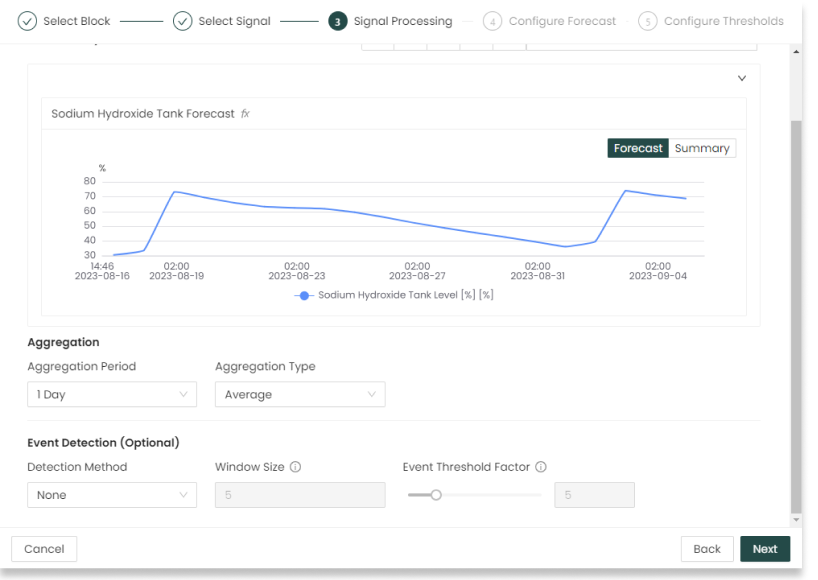
Fig. 3. Trend Forecasting block window showing Step 3 for signal processing, with default configuration values selected/filled in.
As signal processing options are selected, a visual preview of the processed signal will be displayed including:
- The aggregated historical data
- Any events that were detected within the date range of the preview window (if event detection was configured)
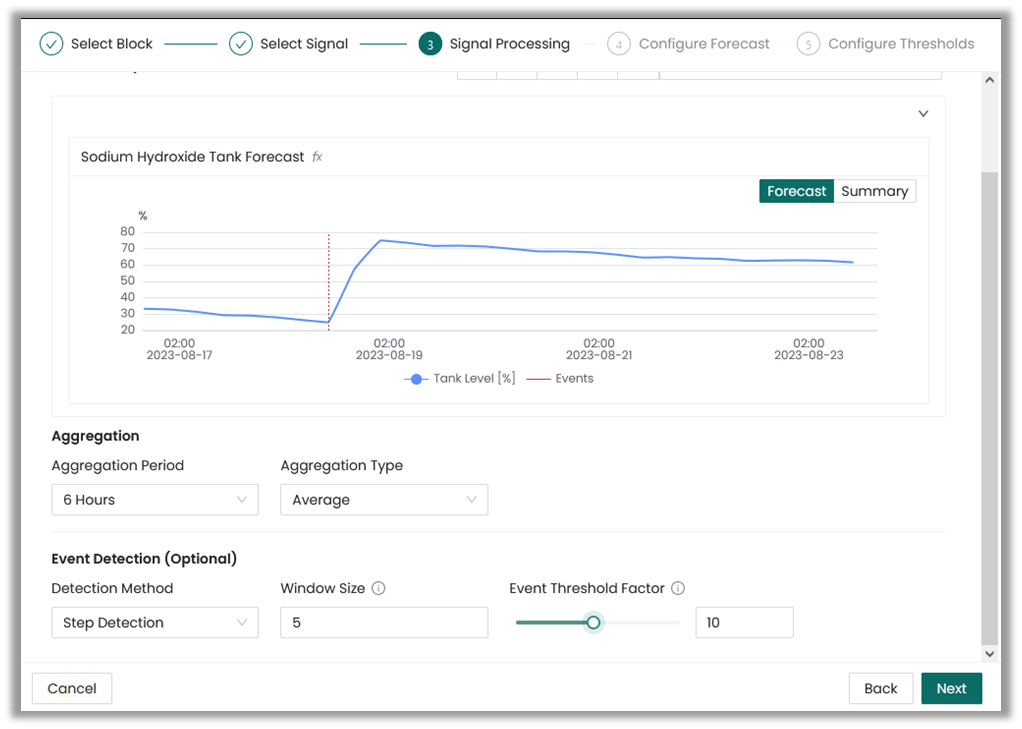
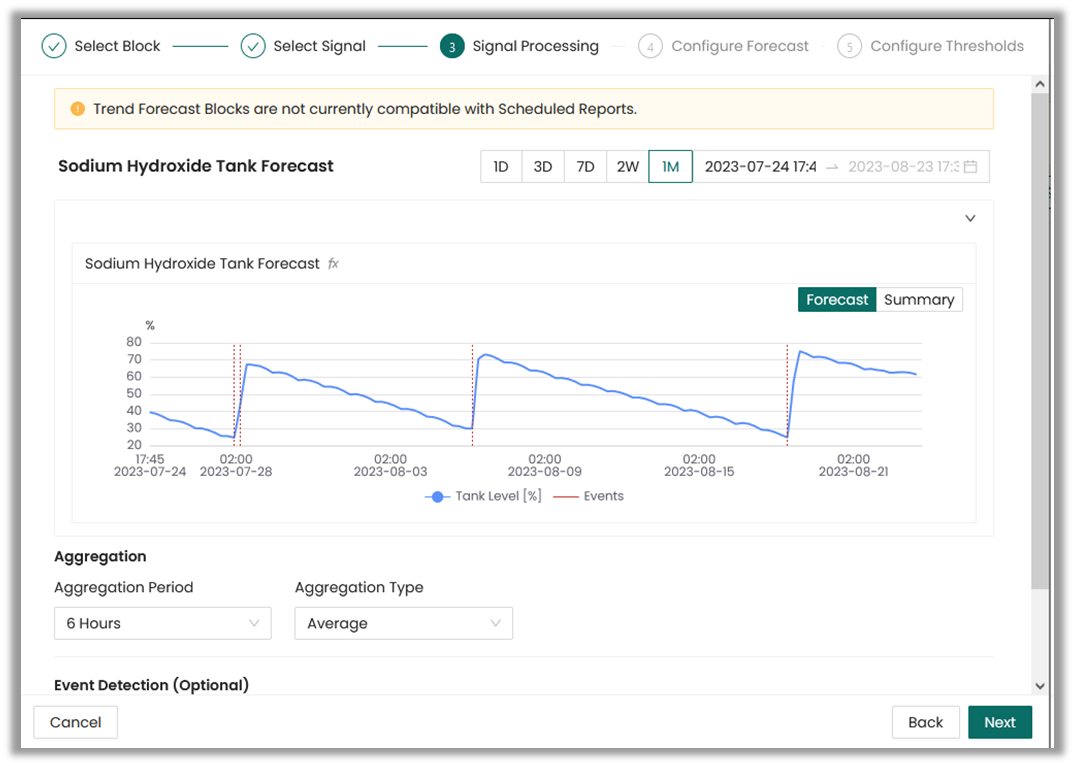
Fig. 4. Trend Forecasting block window showing Step 3 Signal Processing preview with updated Aggregation Period, Detection Method, and Event Threshold Factor.
Adjust the options as desired to update.
If event detection was configured, then the date range can be expanded to see how the event detection performs on more data.
Next, configure the forecast to fit a model to the data and make a prediction. The following fields need to be selected or filled in. Note: the configuration can easily be changed, and the user will observe the changes automatically in the preview screen.
1. Forecast Duration is the future period of time for which a forecast will be created. For example, a 3-day prediction.
2. Fitting Period indicates the past period of time to fit the model to the data. For example, an input of "8" would use the last 8 days of data to fit the model to.
3. Model Type prescribes the regression model to be used, with options such as Linear, Quadratic, Cubic, Quartic, Exponential, Logarithmic, and Power.
Note: Keep in mind that the optimal model choice depends on factors such as:
- How well the model matches your historical data during fitting period.
- The model performance in forecasting future trends over the specified forecast duration.
- Evaluating model performance using the fitting error metric.
The values to pick for the configuration will depend on the use case for the forecast and the trend of the data
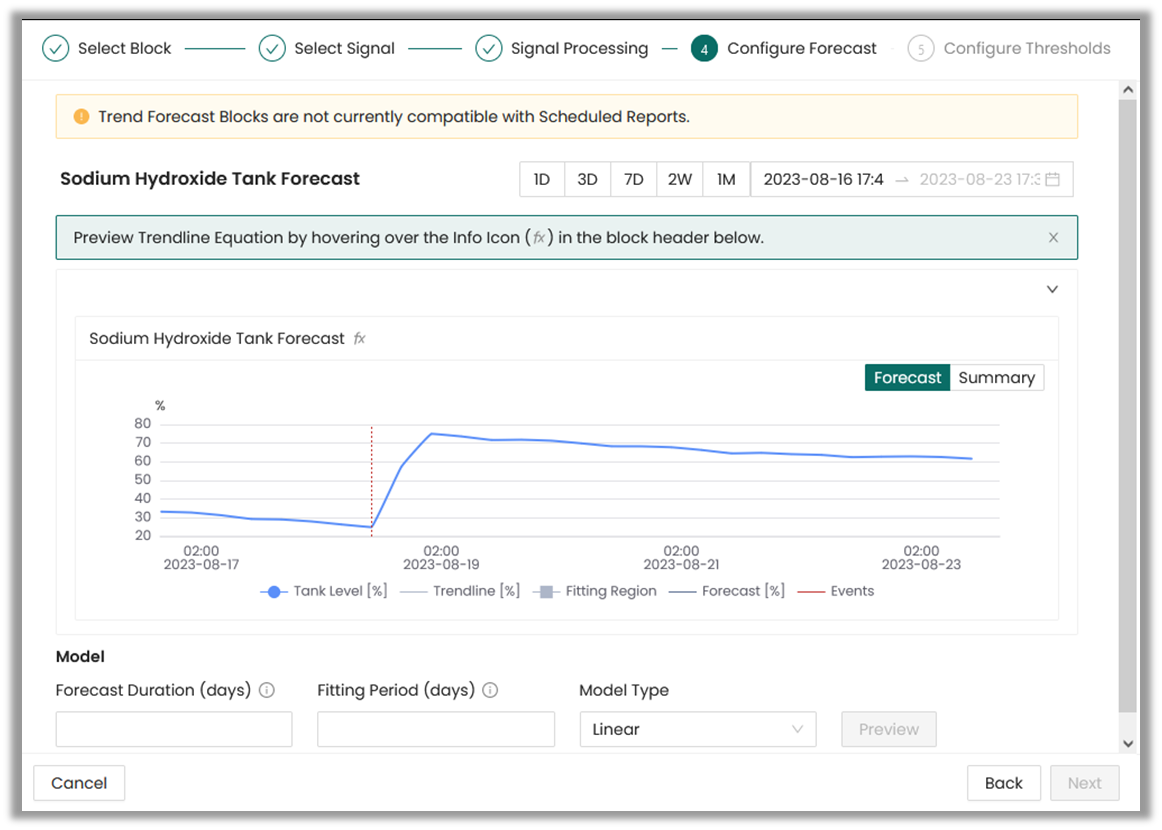
Fig. 5. Trend Forecasting Block configuration showing Step 4, Configure Forecast fields.
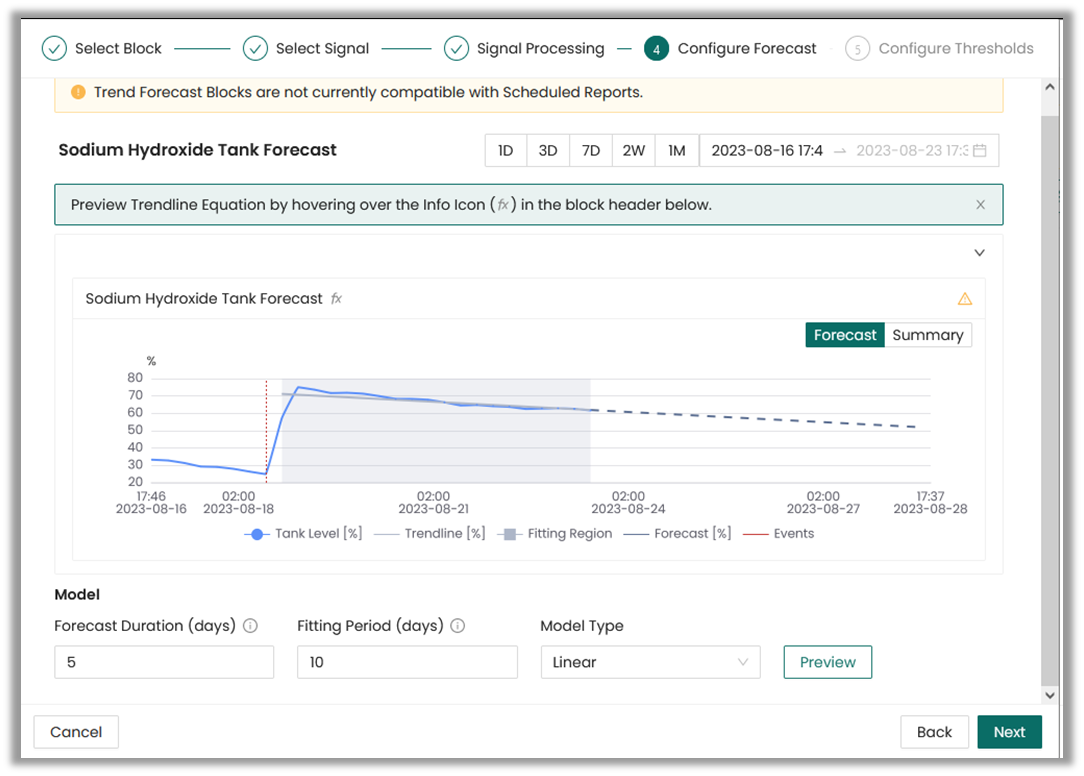
The tool offers a couple of convenient tools to validate the forecast performance:
- A visual preview of the forecast including:
- The historical data
- The forecast (prediction) prescribed by the Forecast Duration
- The trendline. This indicates how the model fits the recent data prescribed by the Fitting Period
- The forecast's fitting region, prescribed by the Fitting Period. If event detection is configured and an event is detected within the Fitting Period, the fitting region will begin after the most recent detected event.
- Any events that were detected in the Signal Processing step (if event detection was configured).
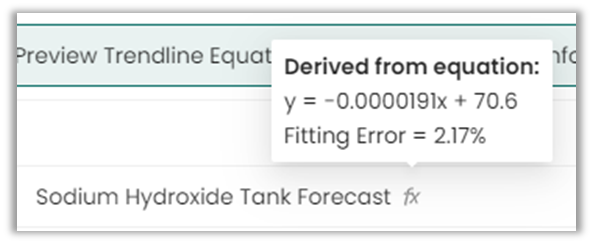
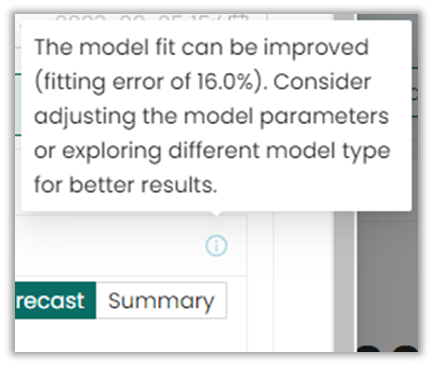
- A quantitative metric called Fitting Error is used evaluate the absolute error between the actual values and the forecasted values within the fitting period. It ranges from 0% to 100%, with 0% being the perfect fitting and 100% the worst case. Values closer to 0% are better, with values below 8% generally being good fits.
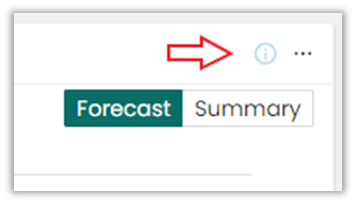
The Function Info Icon (![]() ) shows the model's Fitting Error and equation.
) shows the model's Fitting Error and equation.
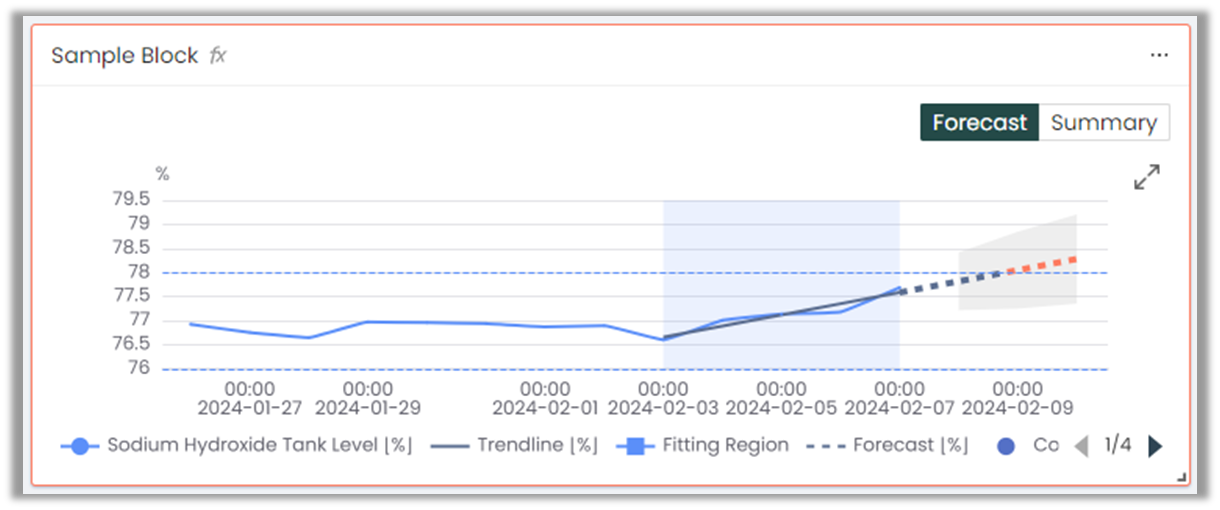
Forecast uncertainty:
In this window, the user can also activate Forecast uncertainty.
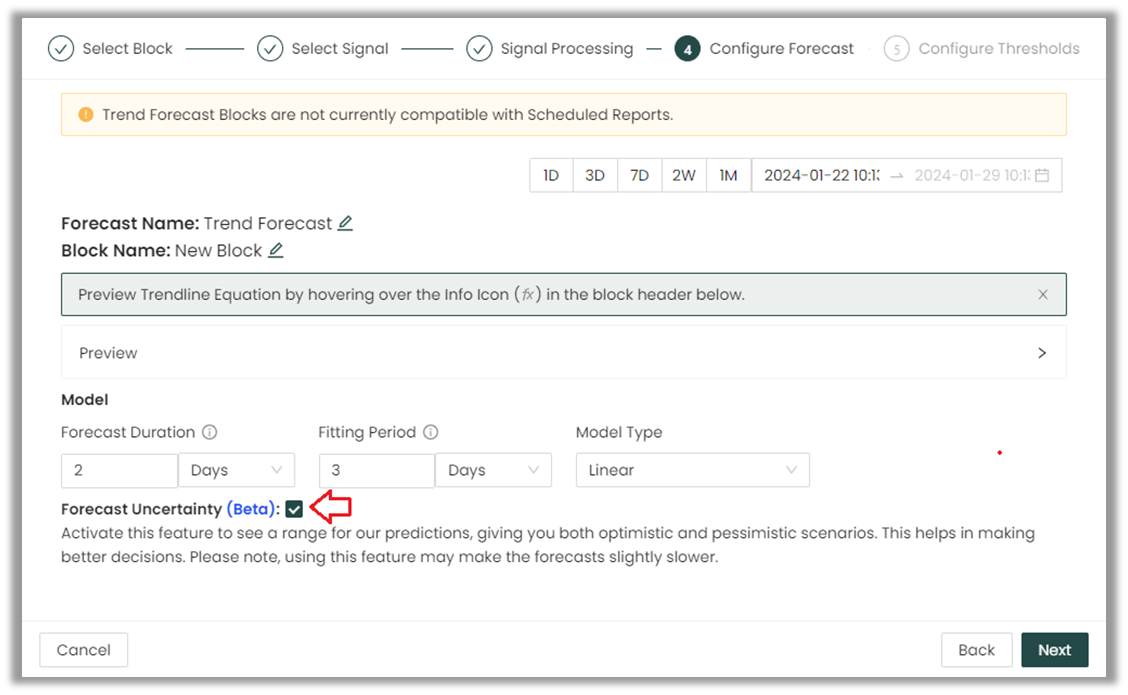
This feature provides a range of dates for the forecasted period based on pessimistic and optimistic scenarios. It empowers users to make well-informed decisions for their plant by offering a flexible timeframe instead of a rigid deadline before crossing a threshold. Note: Forecast Uncertainty Feature will only be visible if it is activated for your plant. If you wish to utilize prediction intervals, please contact support to enable the feature.
1. The feature does not require any detailed configuration from the user.
2. When creating a forecast, make sure that the Forecast Uncertainty Feature box is ticked in the Configure Forecast step.
3. The forecast uncertainty will not appear in the configuration modal. You need to finish the forecast configuration first.
How to read and interpret the Forecast Uncertainty results:
Once the feature is activated, the following changes will occur on your forecast card:
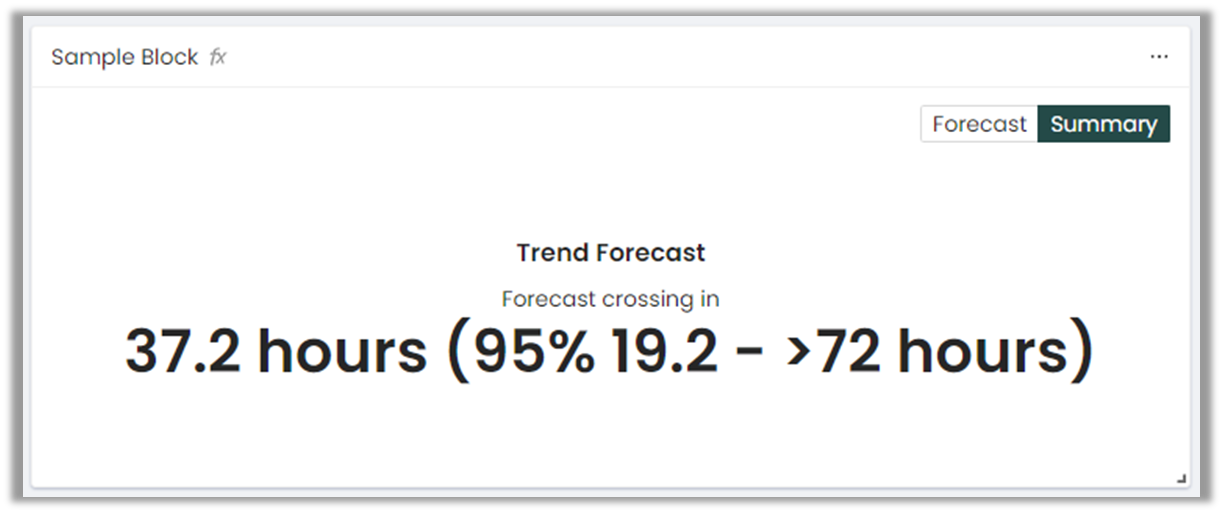
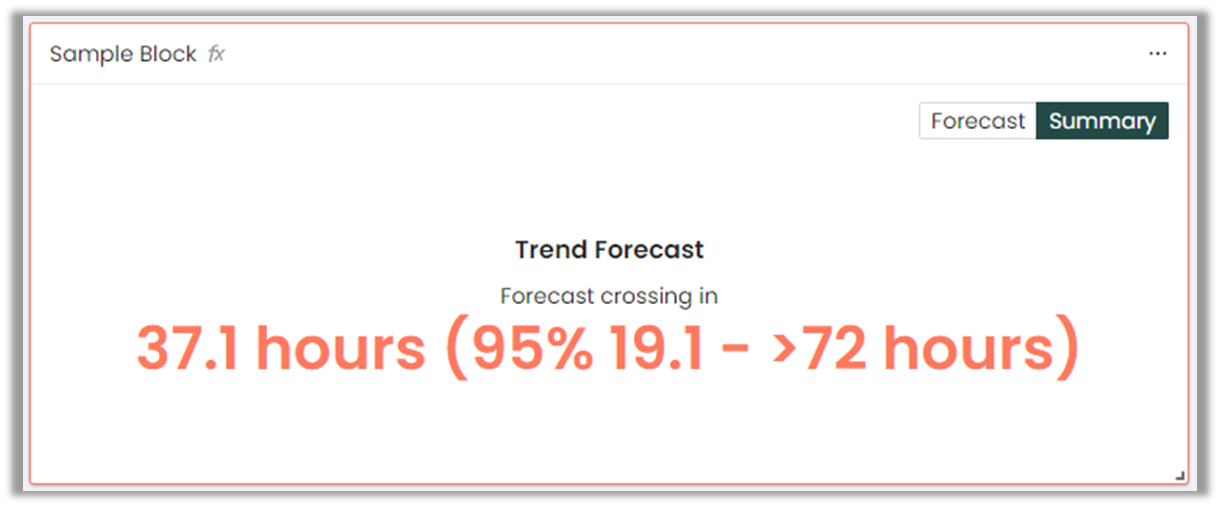
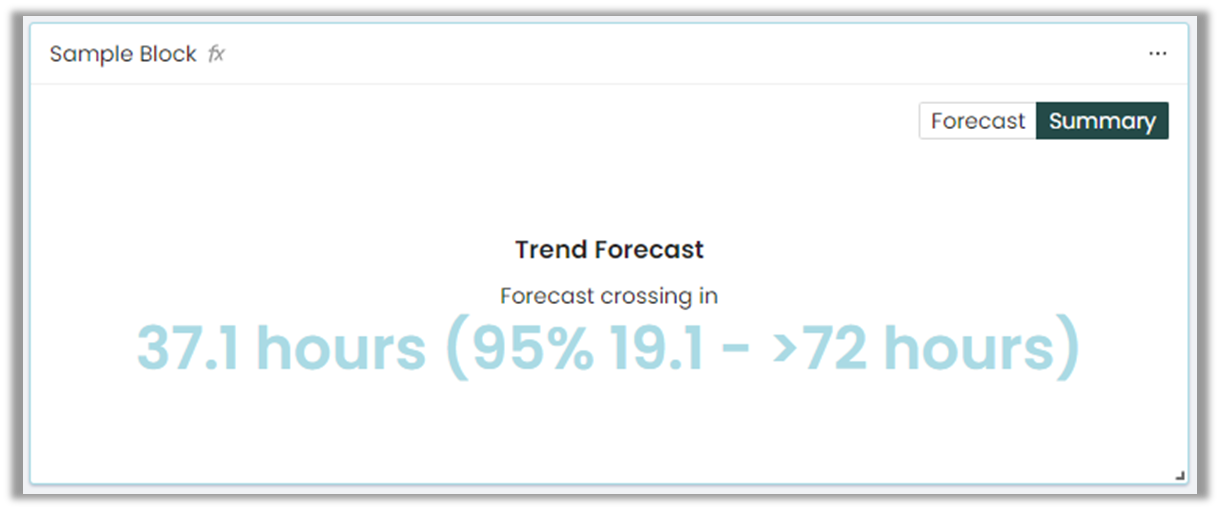
• In the Summary view: Instead of a hard date, a range of dates will be provided for the next time of crossing. The associated confidence (in %) will be shown. A 95% confidence level can be interpreted as "There's a 95% chance that the signal will cross the threshold during the time window indicated". If no threshold was provided in the Configure Thresholds step, the Summary view 's indicated time before crossing is not relevant and should not be considered.
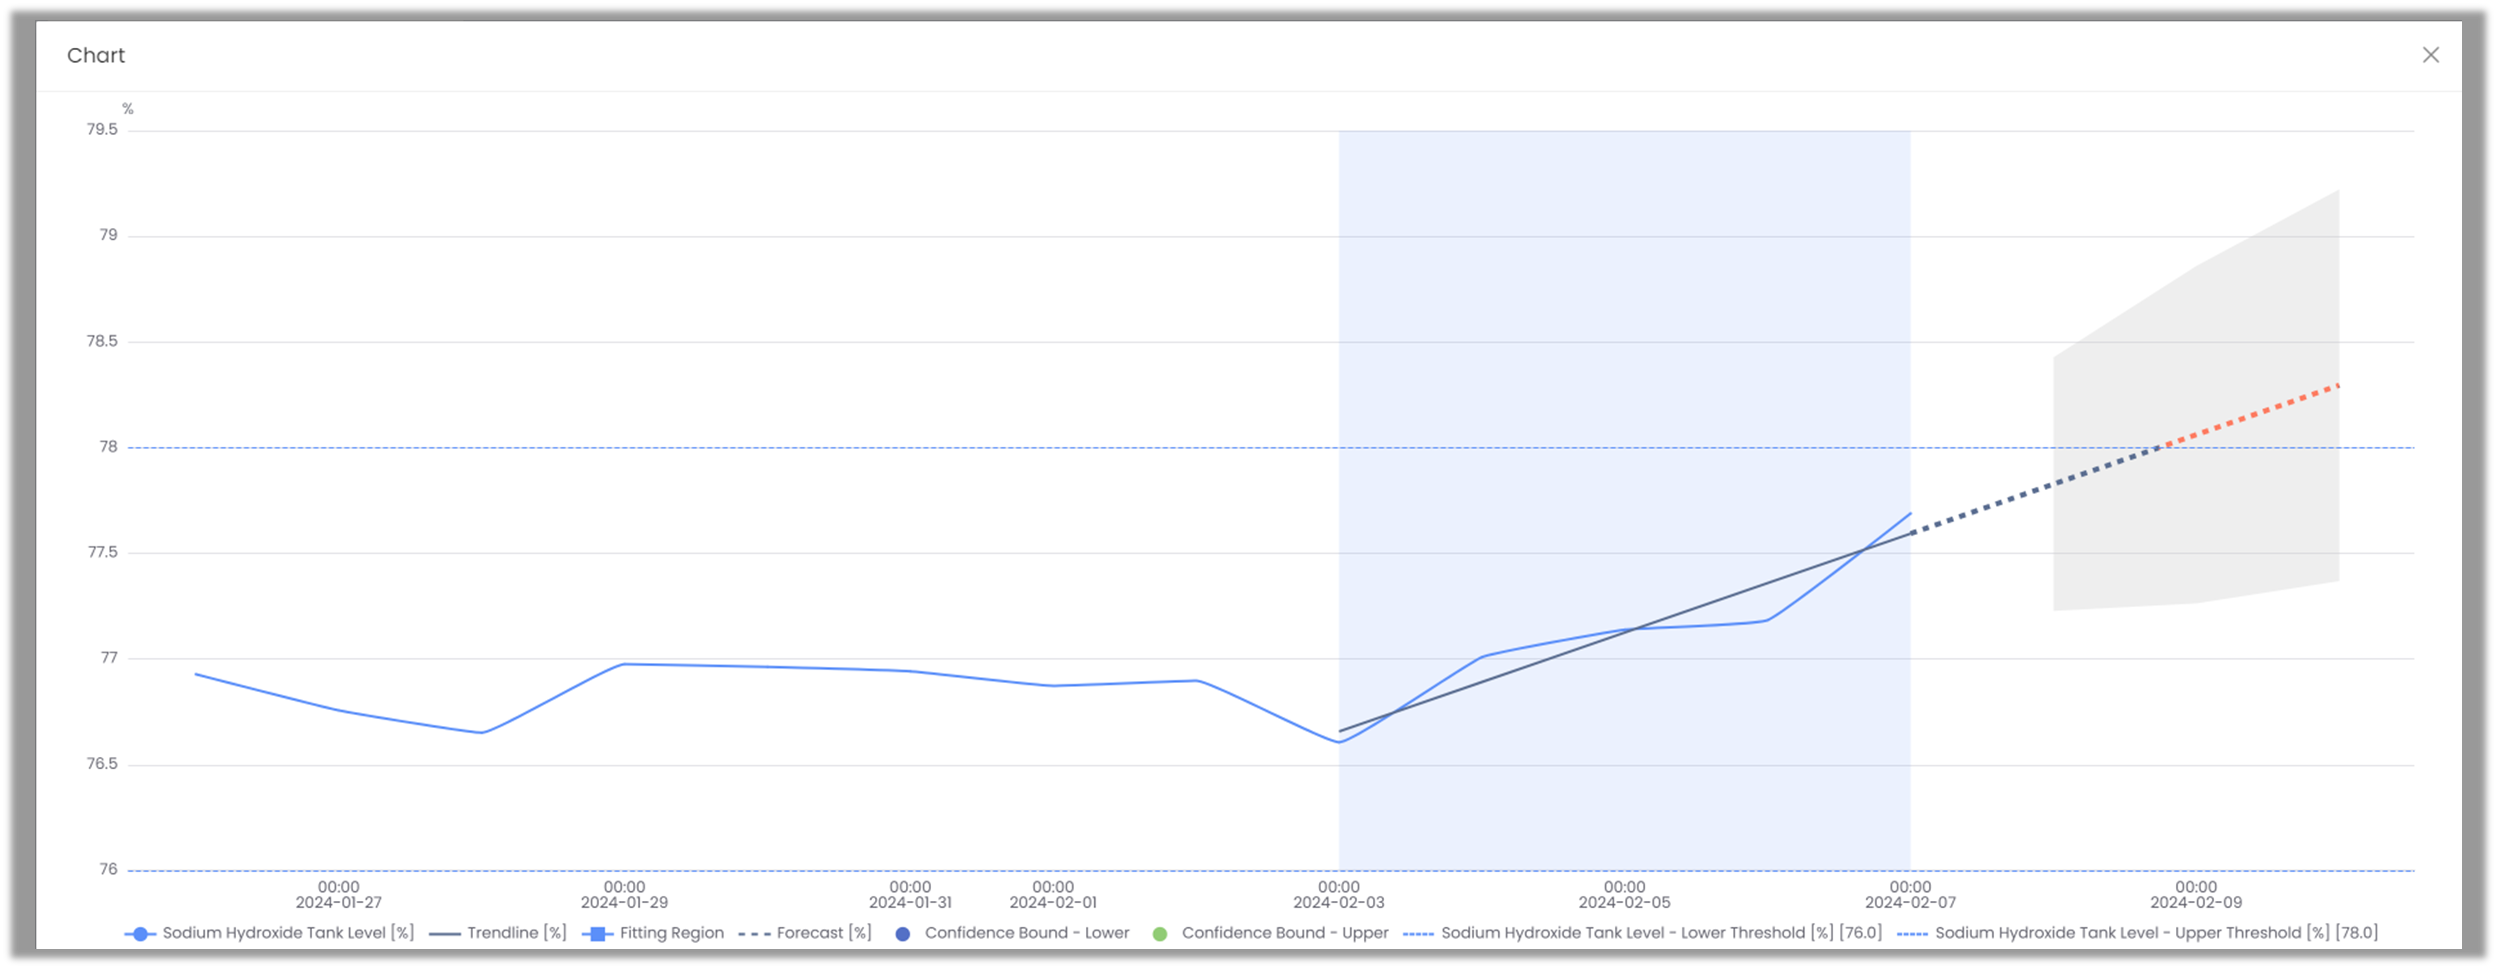
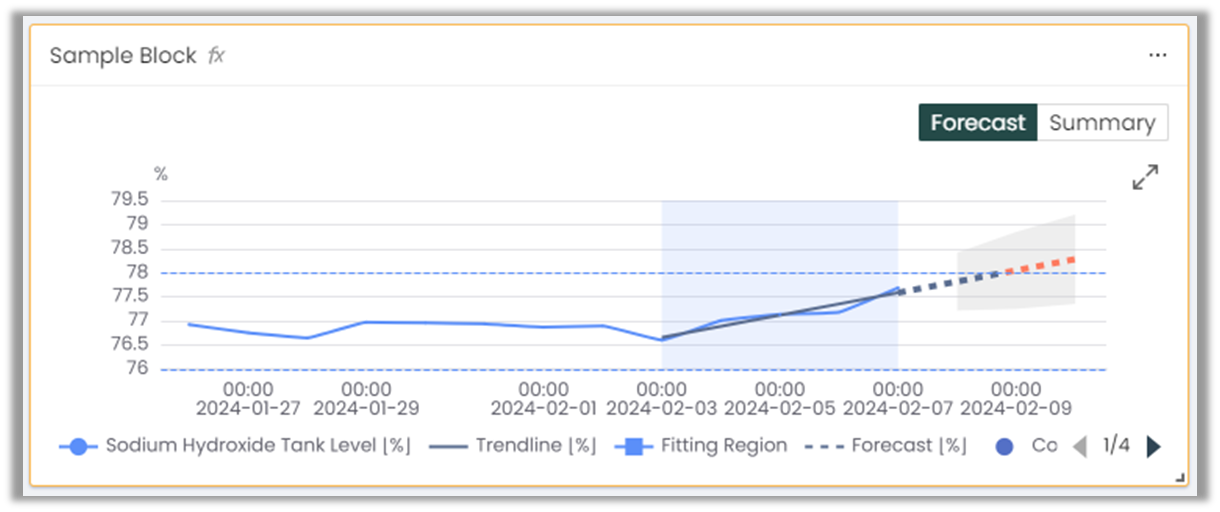
• In the Forecast view: Prediction intervals will appear around the forecasted values, which define the expected range in which these values are likely to lie. The narrower the intervals, the smaller the uncertainty in the forecasted values. Usually, we expect an increase in uncertainty as the forecast duration extends, however this behavior is not systematic.
The final (optional) step is to prescribe thresholds to be displayed on the chart.
Thresholds:
In this window, you can set numerical values to the lower and upper thresholds. Note: alerts can be set up later to notify the user when the forecast crosses these thresholds. Refer to Notifications section for details.
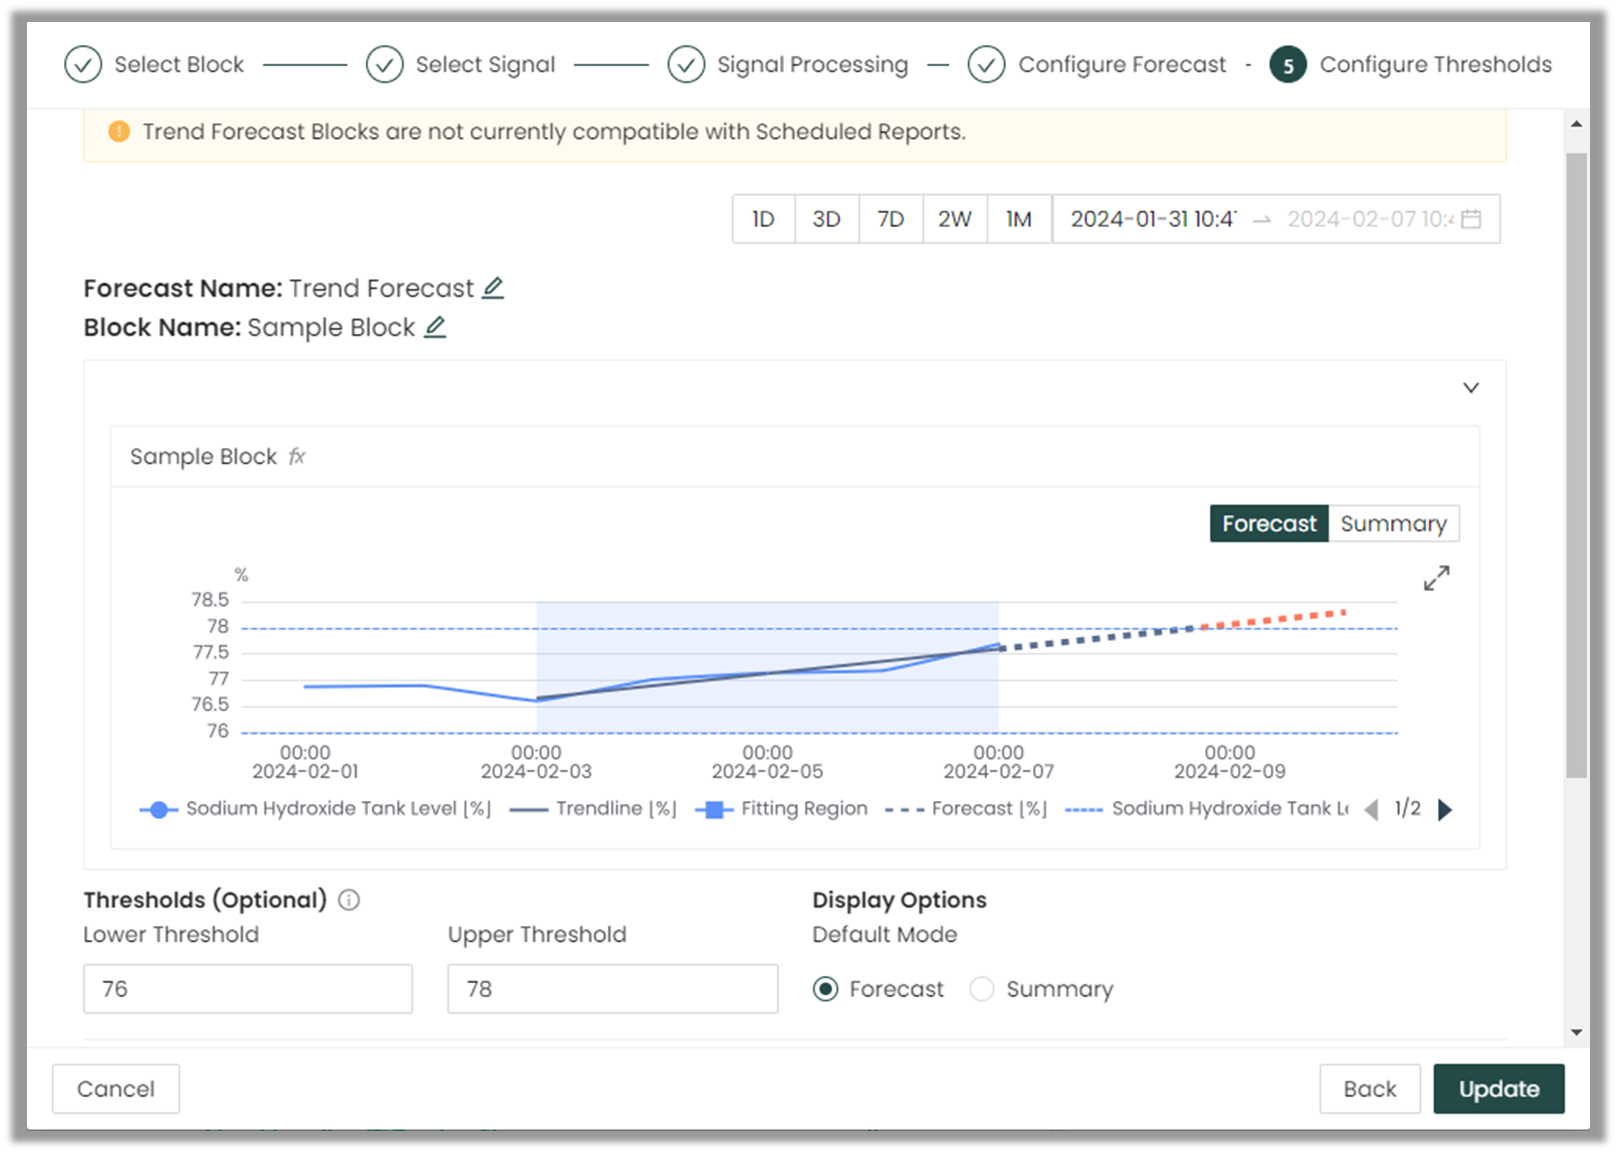
The user can also define Display Options to select the Forecast Block's default display. The display type can be manually toggled from this default using the Forecast/Summary toggle.
Forecast view:
The forecast view is designed primarily for the plant engineer persona. It displays a lot of information, but requires a little bit of thought and time to interpret. It requires more space on an Overview page to display nicely.

Fig. 9. Step 5 showing the Forecast display option
Summary view:
The summary view is designed primarily with an operations manager or similar role in mind. It displays only the information needed to drive a decision based on the forecast's meaning, and requires less time to interpret. For example, if a tank level is being forecast, the most relevant piece of information is when the level will cross its lower limit and the tank needs to refilled. It requires less space on an Overview page to display nicely.
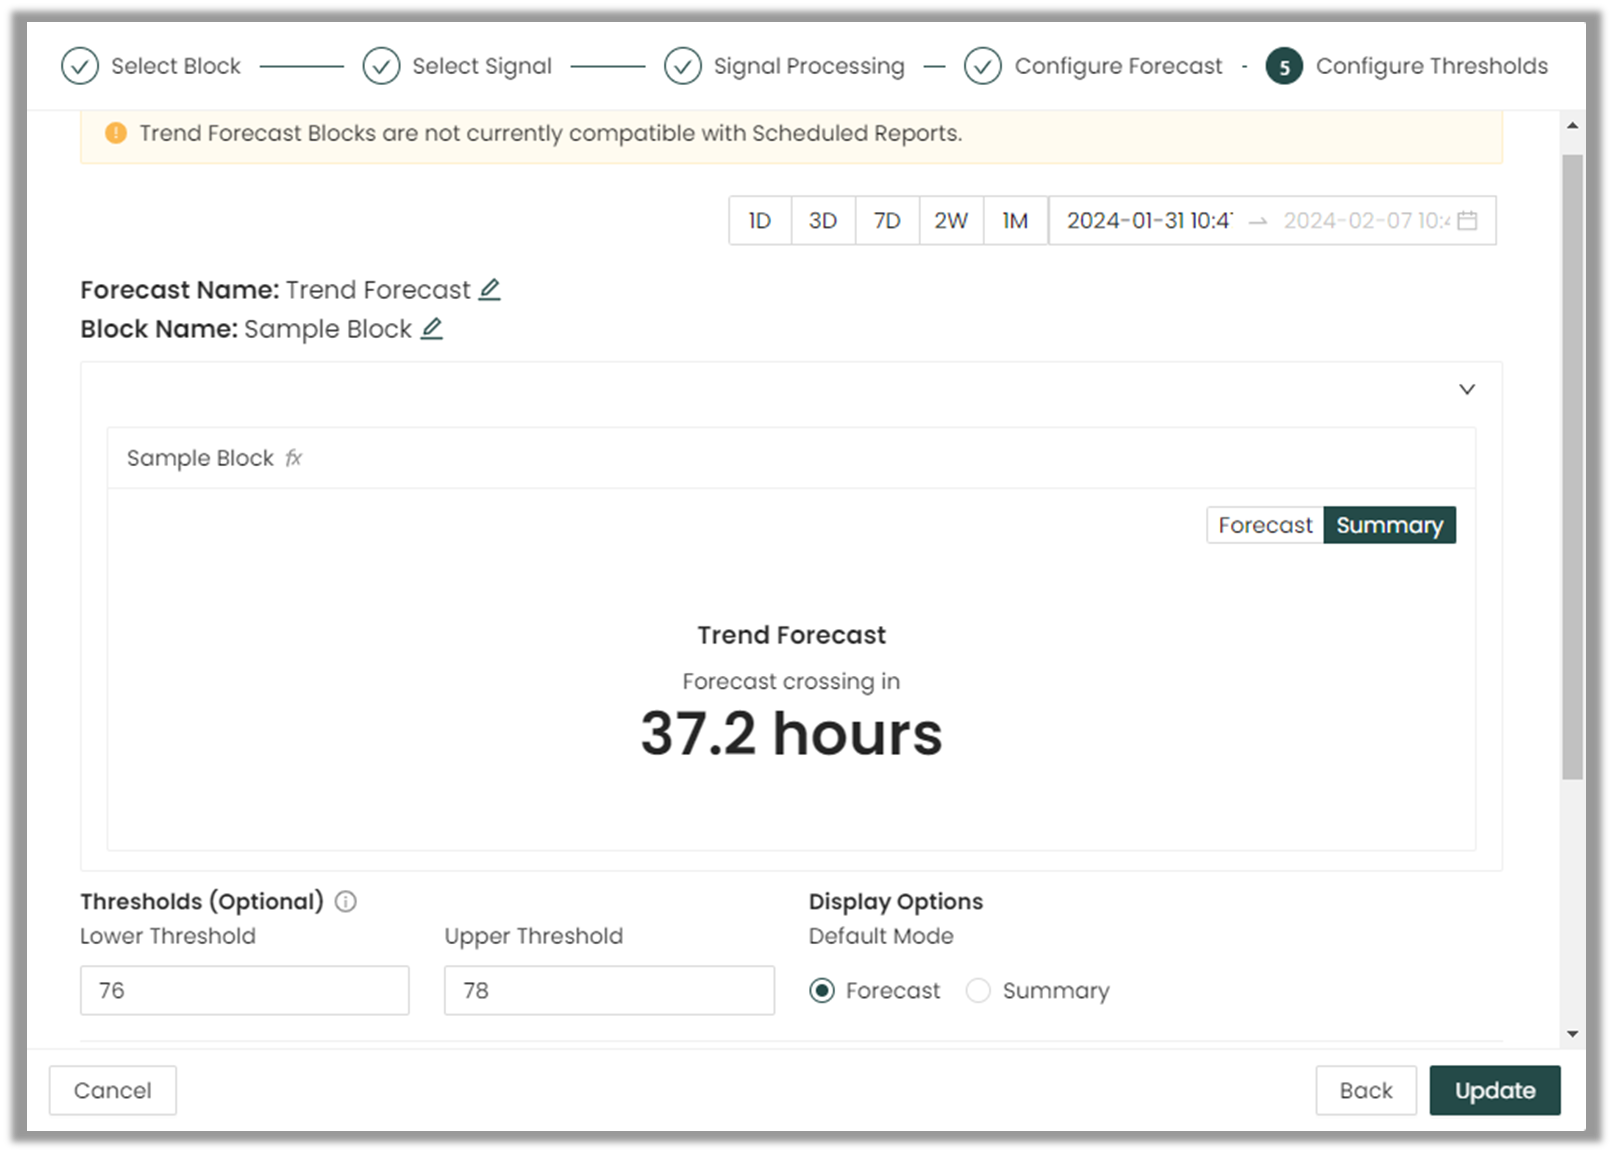
Fig. 9. Step 5 showing the Summary display option
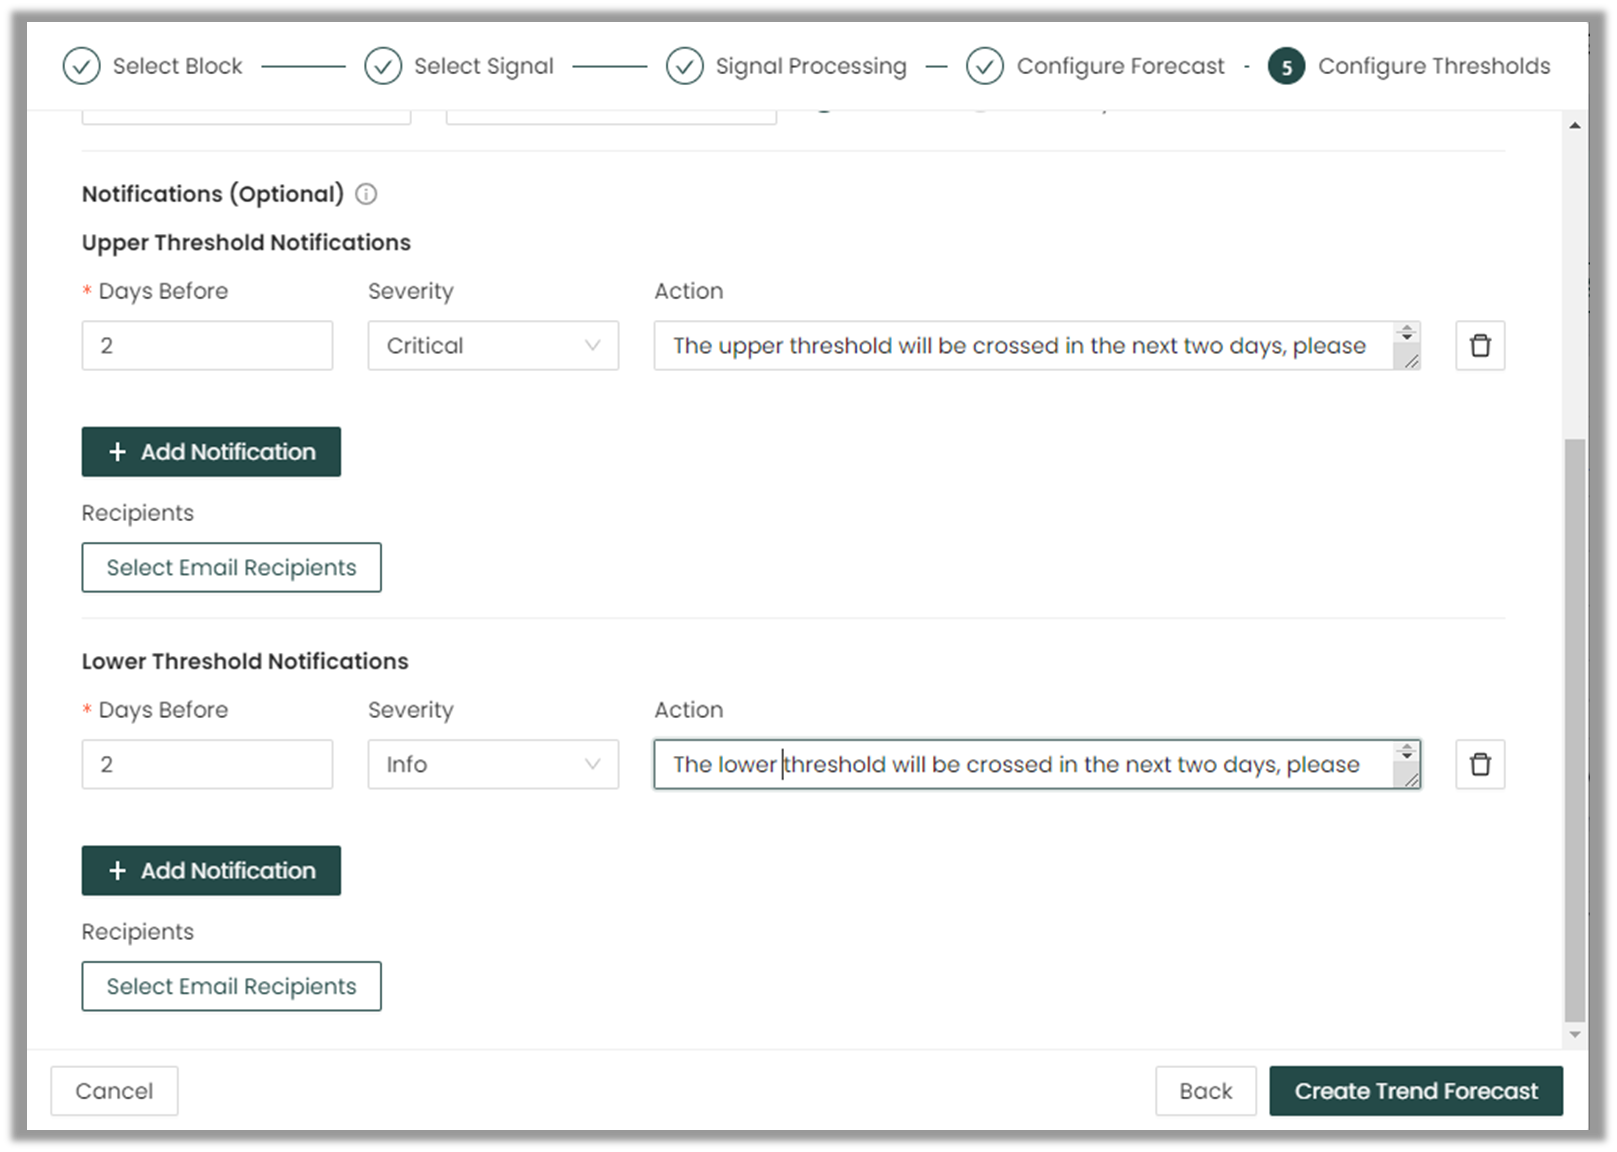
Notifications:
Optionally, the user can set notifications for both upper and lower thresholds. These notifications will trigger highlighting within the forecast block and, if desired, generate in-app notifications and/or email notifications.
- Days Before allows the user to specify how many days prior to reaching the threshold we want to receive the notification.
- Severity enables the user to select the severity level of our threshold, including critical, warning and info. The highlight color is determined by the severity level.
- Action field allows the user to include a written description of the action to be taken
If the severity is Critical the block will turn red:
If the severity is Warning the block will turn orange:
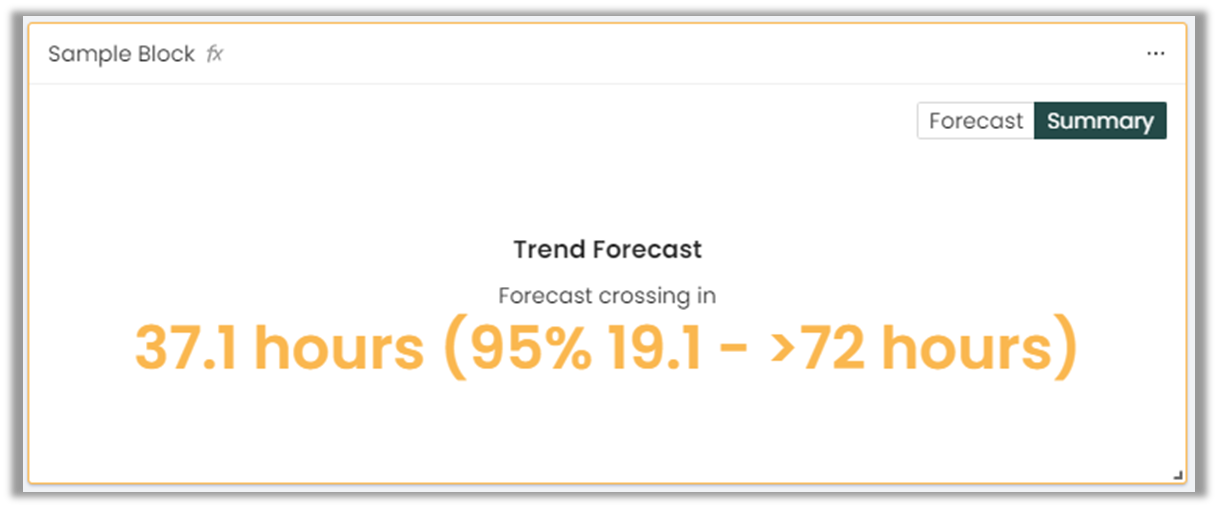
If the severity is Info the block will turn blue:

Additionally, users can add recipients to receive email notifications by clicking on "Select Email Recipients," which will open a new window. In this window, users can select from a list of registered users, opting to choose a single recipient or make multiple selections
Viewing Forecasts
Once you've created your forecast block, it will appear on the Overview view. The forecast will periodically update as more data comes in.
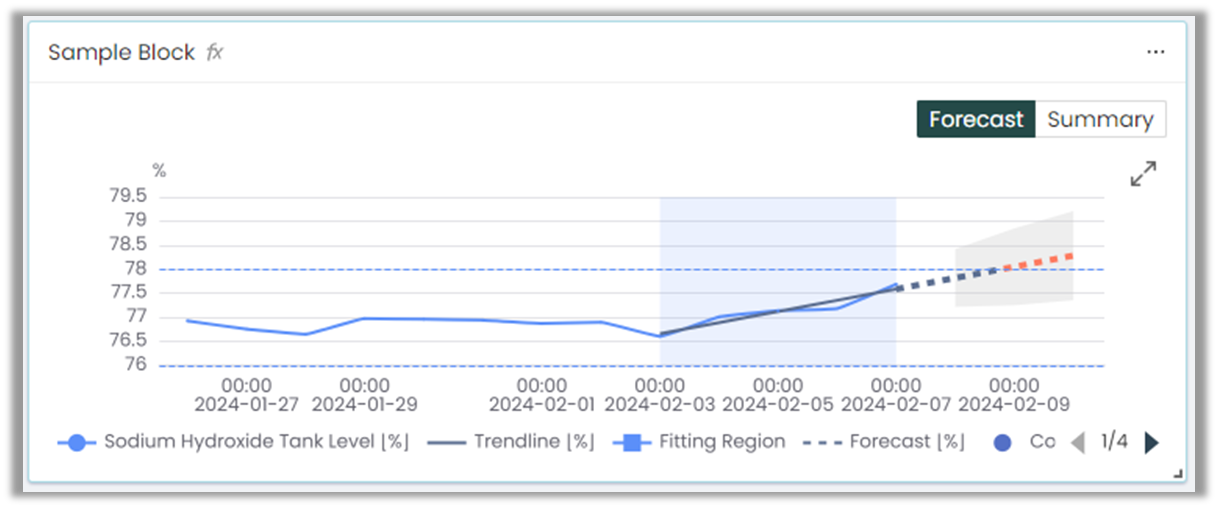
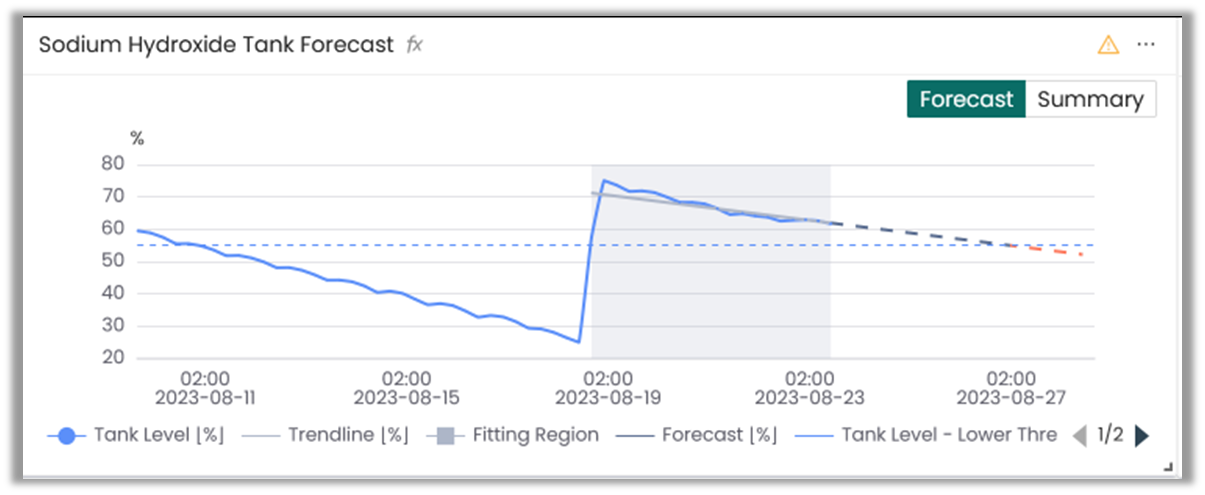
The Trend Forecast block includes:
- The historical data up to the latest available measurement.
- The forecast with data predicted into the future.
- Forecast will turn red where it crosses the threshold.
- The trendline. This indicates how the model fits the recent data.
- The lower and/or upper threshold (if these were prescribed during the forecast creation).
- The forecast's fitting region. This indicates what data was used to fit the forecast model. If event detection is configured, only data from after the most recent detected event will be used to fit the model.
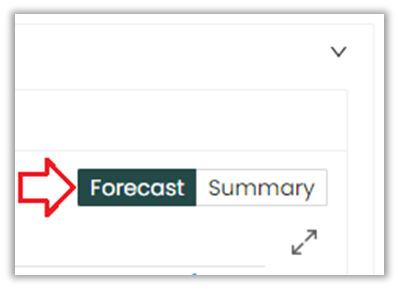
- Forecast/Summary toggle. To switch between Forecast/Summary views.
Forecast view:
Summary view:
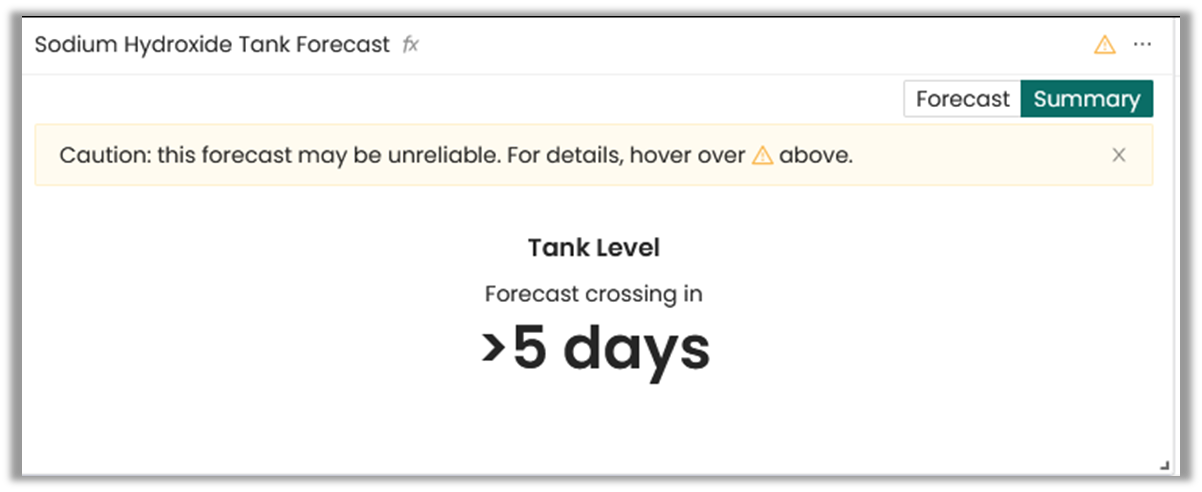
The summary view shows the time remaining until the forecasts cross the threshold and has two variations:
- Forecast crossing in X', representing the exact time remaining to cross the threshold.
- If the value has already crossed, this will display 0.
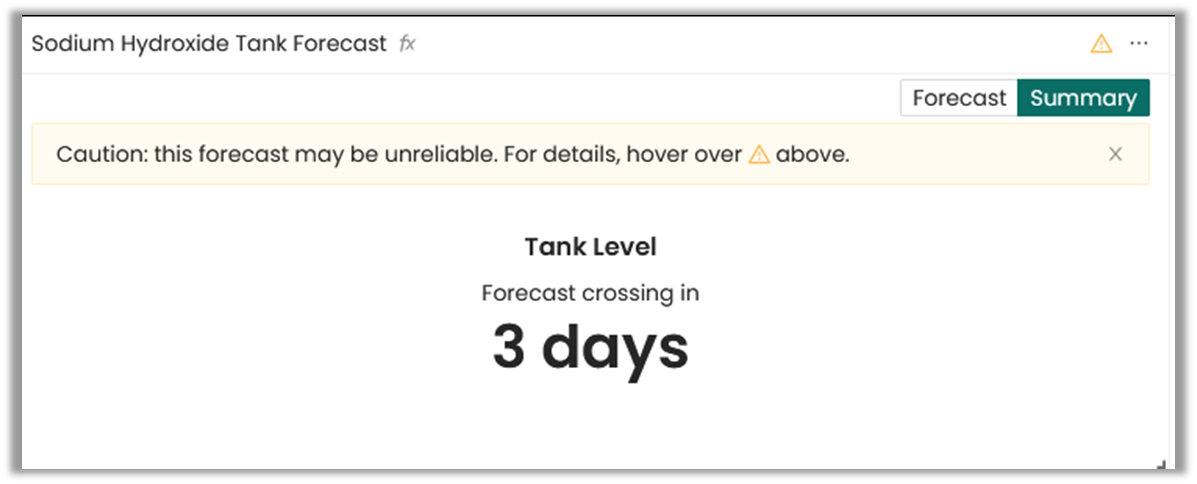
• 'Forecast crossing in >X days', meaning that the forecast did not cross the threshold within the forecast length of X days.
Maintaining Forecasts
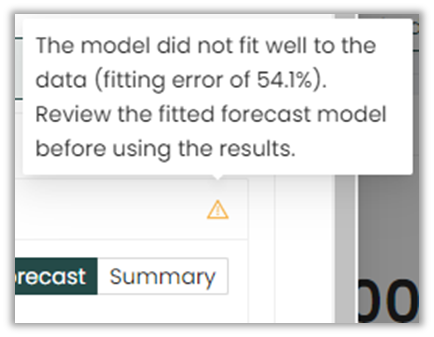
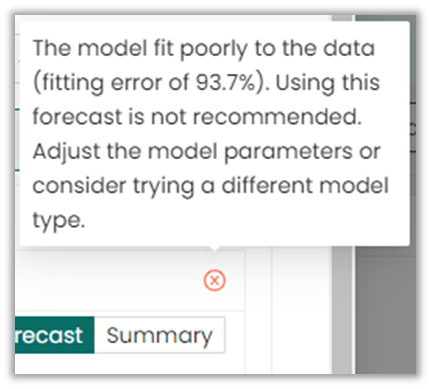
If there are any warnings, the warning icon will show up on top of the chart describing any issue with the forecast such as outdated data, large gaps in the recent historical data.
The tooltip icon shows a description of the warning and a suggested action.
![]() Info
Info
![]() Warning
Warning
![]() Crititcal
Crititcal
Switching views
If the user wants to switch between forecast view and summary view temporarily, it can be done easily by clicking this button. Once the page is refreshed it will be restored to the mode configured in the settings.
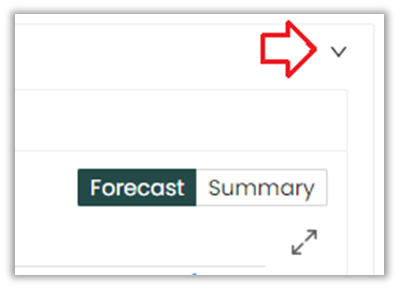
If the user wants to temporarily hide the forecast/summary view from the configuration screen, they can simply use this button. To go back, they just need to press it again.
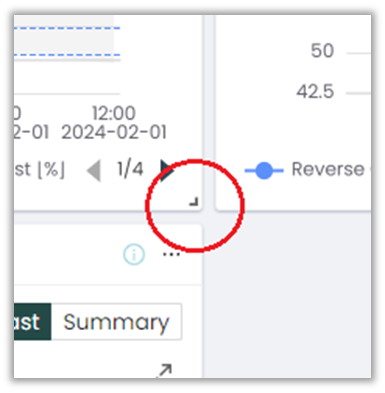
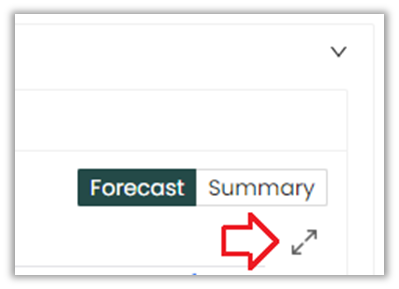
If the user temporarily wants to expand the forecast view, they can easily achieve this by clicking on the button. To return to the normal screen, simply close the window. Note: This feature is exclusive to the forecast chart.
Edit forecasts:
Changing the forecasting settings can help improve the forecast accuracy or resolve issues brought up by the warnings. The forecasting settings (such as the Fitting Period) can be easily updated via the "edit" functionality.
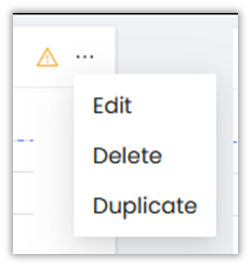
The user also has the option to adjust the size of the block in the overview panel.