
KPI’s are Key Performance Indicators used to monitor the health and performance of your plant. KPIs are used throughout the system to generate reports, graphs and trigger alerts. All KPIs functions are accessible on the Guide and Consult plans. The View and Focus plan's KPI functions are a subset of Guide and Consult functions by default, however can be upgraded via the Pani sales team upon request on a contract basis.
KPI Creator allows operators and administrators to create their own KPIs. A KPI can be:
- A single sensor reading.
- Single/multiple sensors with arithmetic operations that calculate new metrics.
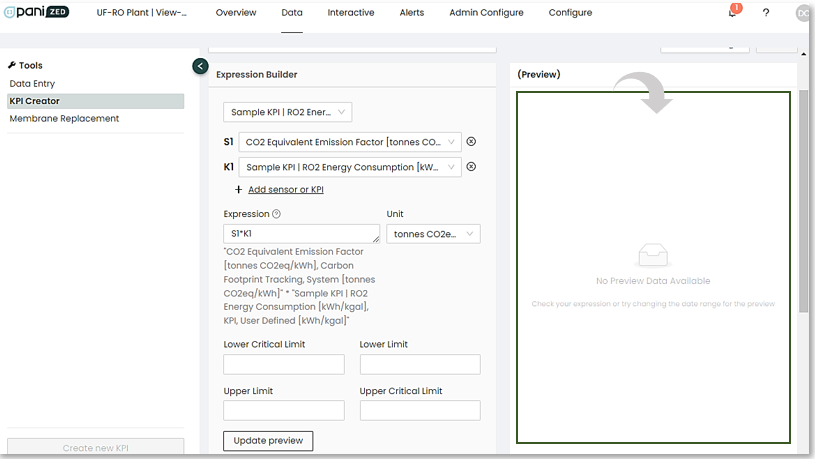
- The combination of 2 or more KPIs.
By creating KPIs as an intermediate function for another KPI, more complex and potentially insightful KPIs can be created. KPIs are used to drive Overview and Interactive reporting, Analytics, Alerts and Home page dashboards.
|
The process for creating KPIs is as follows: Step 1: Build performance KPIs that are important to your plant operations. (see Creating KPIs). |
Expressions
In the Expression Builder section of KPI Creator you will find the the various KPI listed that you can utilize by clicking on the Expression "?" icon.
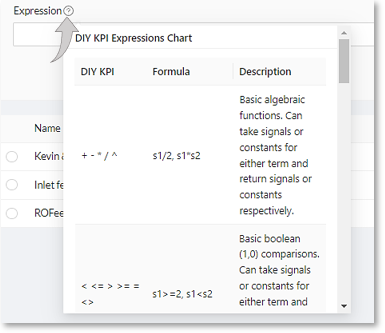
Before you can create any KPIs it is important to know the arithmetic operations that are allowed in the expressions and calculations. These include:
- Basic operators - addition, subtraction, multiple, divide, exponents (+ - * / ^)
- Parenthesis – ( )
Arithmetic Functions
KPIs can use the following arithmetic expressions to support normalized calculations:
In the nomenclature below, SIGNAL can mean a sensor, KPI, or an arithmetic equation featuring sensors and/or KPIs.
For example, Ln also referred to as "Natural logarithm":
Ln(Sensor_name)
Ln(KPI_name)
Ln(Sensor1+sensor2)
List of Expressions available:
| align_and_ffill | mask | sqrt (square root) |
| avg | stdev | |
| filter | min | sum |
| Ln (log base e) | nanmean | var |
| Log10 (log base 10) | timeshift | exp |
Log10 (log base 10)- log10 calculation, often used in normalizing parameters.
- USAGE – log10(SIGNAL)
- SYNTAX - log10(s1)
Ln (log base e)- calculates the natural logarithm, often used in normalizing parameters.
- USAGE – ln(SIGNAL)
- SYNTAX - ln(s1)
sqrt (square root) – square root calculation
- USAGE – sqrt(SIGNAL)
- SYNTAX - sqrt(s1)
filter - this function allows a signal to be bound by upper and lower limits. It creates a range where the output of a signal is valid and will display data. This implies an AND operation that is greater than/equal to and less than/equal to (see operands).
- USAGE – filter(SIGNAL,lower_limit,upper_limit)
- SYNTAX - filter(s1, 123, 234), where 123 is the lower limit and 234 is the upper limit
mask - this function restricts the display of the sensor or KPI data to a range. it allows a signal to mask another signal/KPI. This is useful if you want to have one signal act as an on/off signal for another, so that reporting averages are only calculated when the plant is running, for example.
- USAGE – mask(SIGNAL1,SIGNAL2,argument), where the argument is any valid object or equation containing a <, >, = and a value.
- SYNTAX - mask(s1,s2 OPERAND NUMBER), where s1 is the sensor driving the KPI, and s2 is the sensor that, when active, is masking the KPI. Active is defined by the argument being TRUE.
- mask(k1,s2=1) k1 only provides data when s2 is 1, this is useful for plant on/off signals masking the sensor data when a plant is offline
nanmean - the nanmean function takes a variadic number of arguments, aligns all them on their index, and takes the mean at each index, ignoring nans or missing values (e.g., nanmean(s1,s2,s3) will take the series s1, s2, and s3 and return the mean of those three signals at each index for which they have values). In other words, this function takes multiple signals - between 2 and 9 - and returns a signal where the value at each index is the average of all the input signals that have a value at the same index, and missing or nan values are ignored.
- SYNTAX - nanmean(S1, S2, ...) where S1, S2, ... are each a sensor, KPI, or equation comprised of sensors, KPIs and other functions. Between 2 and 9 inputs may be provided.
The following operands are supported and are only used in the MASK function:
| < | Less-than |
| > | Greater-than |
| <= | Less-than-or-equal |
| >= | Greater-than-or-equal |
| <> | Not equal |
| = | Equal |
The FILTER and MASK functions require a sensor as the first argument in the expression and one or more sensors or KPIs for the right-hand argument. The output of these functions is a TRUE/FALSE result that acts upon the signal(s) being referenced in the equation.
timeshift - this function shifts the sensor/signal value used in the KPI by a specific fixed number of days, hours, or minutes, depending on the sensor/signal and desired result. This can be useful when wanting to convert a meter reading to daily/weekly/monthly usage for things like energy, mileage, water usage, etc. or doing week over week or month over month comparisons for things like energy used this month and last month (with month represented by, for example, 30D or 31D).
- SYNTAX - timeshift(sensor_name, integerTime)
- Where 'sensor_name' is the name of the desired user sensor, KPI, or expression returning timeseries data
- Where 'integer' is any whole number, combined with one of either D for days, H for hours, or M for minutes, e.g. 7D, 12H, 5M.
- Note, 'month' is not supported because the number of days in a month varies and therefore is not a fixed duration.
- Where positive values look back, and negative values look ahead from the current value.
timeshift(s1,1D) , where s1 is the name of an energy meter, and the time shift is 1 Day
- If today's energy reading is 1000kw/h and yesterday’s reading is 700kw/h, the above equation would be 1000 - 700 = 300kw/h used
Converting shift to timeshift
Many uses of the shift function are more suitable to the timeshift function, so conversion is required. During conversion, some signals with added complexity may require additional steps to the syntax, such as dividing the timeframe into sub-components. For example:
Original Expression: "S1-shift(S1,1200)" using the old 'shift' function.
- This expression shifts the S1 signal by 1200 data points (which corresponds to shifting by 1200 minutes or 20 hours) using the shift function.
New Expression: "timeshift(avg(S1, 1min), 20H)" with new timeshift function.
- We want to use the timeshift function instead of the shift function to optimize computational resources. Since the data for this signal comes in minute intervals, we'll need to adjust the timeshift value accordingly.
Conversion: We'll calculate the average of S1 over 1-minute intervals: avg(S1, 1min).
Then, we'll apply a timeshift of 20 hours to this average signal: timeshift(avg(S1, 1min), 20H).
If the default syntax does not work for you, feel free to reach out to Pani Support and we'll be happy to troubleshoot with you.
Functions listed below are additional Guide/Consult Features
align_and_ffill - takes a signal and adds timestamps to align it with another signal. After alignment, the first signal is filled forward. This is useful if you want to create KPIs that use a manual reading and hourly SCADA data, for example, to use in a calculation.
- USAGE – align_and_ffill(price_chemicals, daily_chemical_consumption) would transform the price of chemicals to a daily value, taking the latest price available and filling it forward.
- SYNTAX - align_and_ffill(s1, s2), where s1 is the signal getting transformed and filled, and s2 is the signal with the desired frequency.
align_and_ffill(s1, s2)*s2,
This example takes a signal that changes infrequently like the price of chemicals s1 (monthly on a form) and aligns it with hourly chemical consumption s2 and then multiplies it by hourly chemical consumption to produce the KPI for Hourly Chemical Cost
avg - takes a signal and calculates the average across a time window.
- USAGE – avg(flow_rate, 1D) would calculate the daily average flow rate
- SYNTAX - avg(s1, time_window), where s1 is the signal and the time_window is one of : 1m, 1H, or 1D for 1 minute, 1 hour, or 1 day respectively.
This example takes a signal like flow rate and finds the average over a one-hour time period
max - takes a signal and calculates the maximum across a time window.
- USAGE – max(flow_rate, 1H) would calculate the hourly maximum flow rate
- SYNTAX - max(s1, time_window), where s1 is the signal and the time_window is one of : 1m, 1H, or 1D for 1 minute, 1 hour, or 1 day respectively.
This example takes a signal like flow rate and finds the maximum over a one-day time period
min - takes a signal and calculates the minimum across a time window.
- USAGE – min(flow_rate, 1H) would calculate the hourly minimum flow rate
- SYNTAX - min(s1, time_window), where s1 is the signal and the time_window is one of : 1m, 1H, or 1D for 1 minute, 1 hour, or 1 day respectively.
This example takes a signal like flow rate and finds the minimum over a one-minute time period
stdev - takes a signal and calculates the standard deviation across a time window.
- USAGE – stdev(flow_rate, 1H) would calculate the hourly standard deviation flow rate
- SYNTAX - stdev(s1, time_window), where s1 is the signal and the time_window is one of : 1m, 1H, or 1D for 1 minute, 1 hour, or 1 day respectively.
This example takes a signal like flow rate and finds the standard deviation over a one-day time period
sum - takes a signal and calculates the sum across a time window.
- USAGE – sum(flow_rate, 1H) would calculate the hourly sum flow rate
- SYNTAX - sum(s1, time_window), where s1 is the signal and the time_window is one of : 1m, 1H, or 1D for 1 minute, 1 hour, or 1 day respectively
This example takes a signal like flow rate and finds the sum over a one-minute time period
var - takes a signal and calculates the variance across a time window.
- USAGE - var(flow_rate, 1D) would calculate the daily flow rate variance.
- SYNTAX - var(s1, time_window), where s1 is the signal and the time_window is one of : 1m, 1H, or 1D for 1 minute, 1 hour, or 1 day respectively.
Description – this example takes a signal like flow rate and finds the variance over a one-hour time period
exp -Calculates the exponential (e raised to the power of the input) for any signal or constant.
- USAGE – exp(s1) would calculate the exponential of signal s1, useful in modelling growth or decay trends.
- SYNTAX - exp(s1), where s1 is the signal you want to apply the exponential function to.
KPI creation is easy, but does require that sensors, or Fields, be set up via FormBuilder. The data entered in FormBuilder will build that database for the KPIs.
To create KPIs in KPI Creator perform the following:
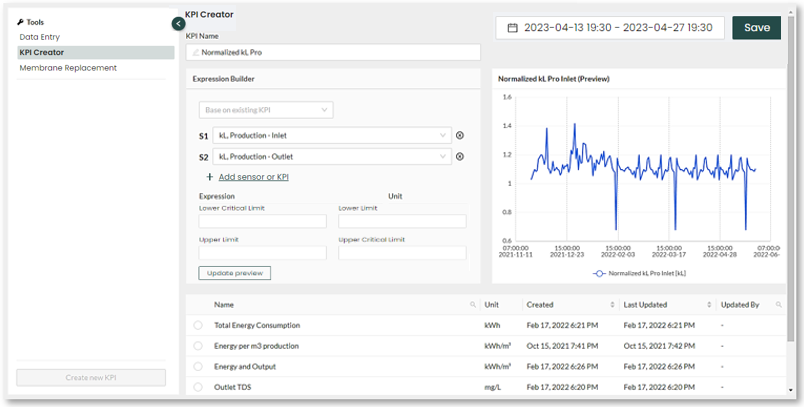
Step 1: Open the "KPI Creator" from the sidebar menu in the Data section. The default view in
KPI Creator is to create a new KPI, or you can select a KPI from the menu.
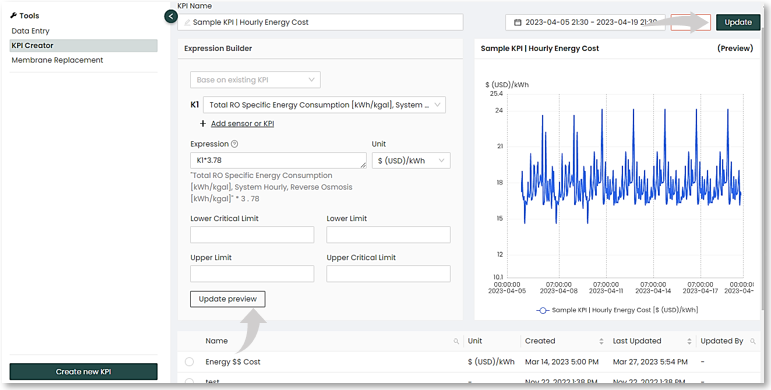
- Copy an existing KPI by selecting it in the "Base on existing KPI" pulldown field.
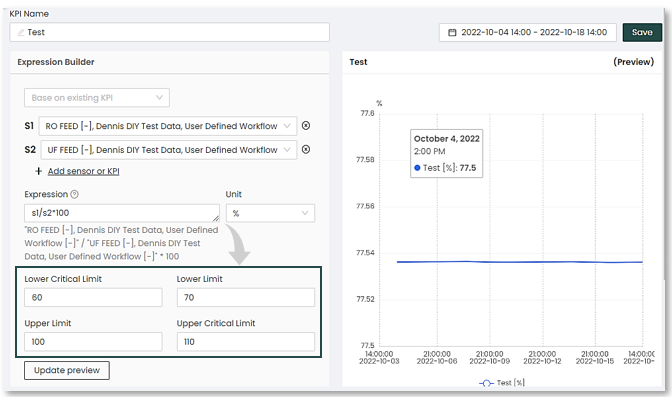
Step 2: Give the KPI a Name.
Step 3: Add sensors/fields. Select the sensors needed to create the KPI expression. If you just
want to create a graph of a single sensor, select that sensor, and build the expression
“=S1”, where S1 is whatever variable is designated to that sensor.
- Keep adding sensors by selecting + Add sensor or KPI until you have all sensors required for the expression.
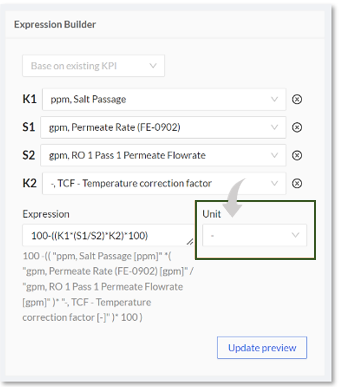
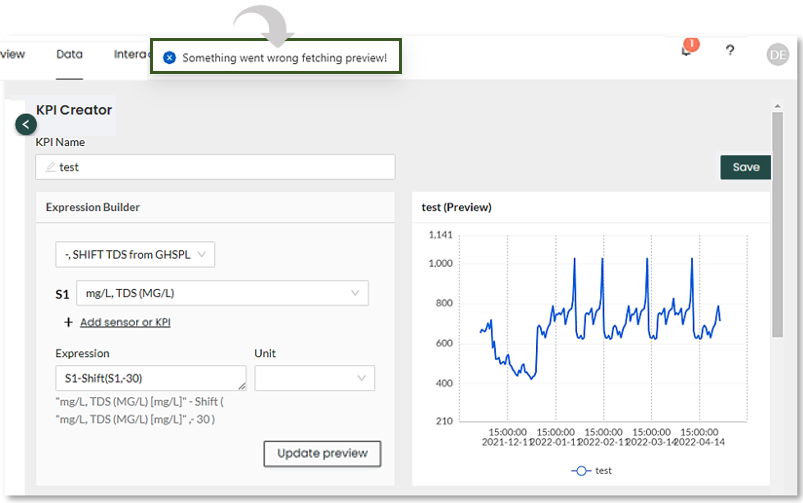
Step 4: Build the expression in the "Expression" field.
- After each sensor, or field is added to the "Expression Builder", a shortened variable name will appear to the left of it (S1, K1, etc.). Use this abbreviated name to create the expression.
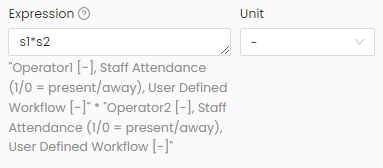
- Think of the Expression field as a spreadsheet cell. Simply type in the equation using the shortened variable name. For example: (S1*S2)/S3+S4.
- The expression can be based on an existing KPI or could be a completely new entity. Base the expression on an existing KPI to speed up the creation of multiple RO trains, for example, or multiple pump KPIs.
Step 5: Add Upper and Lower Limits and Critical Limits to your KPI as shown above (optional).
|
|
Step 6: When you have your expression built, click on the "Update preview" to view the results in the "Preview" window.
Step 7: Once you are satisfied with your KPI, save it using the "Save" button locate in the upper right corner of the KPI Creator screen.
|
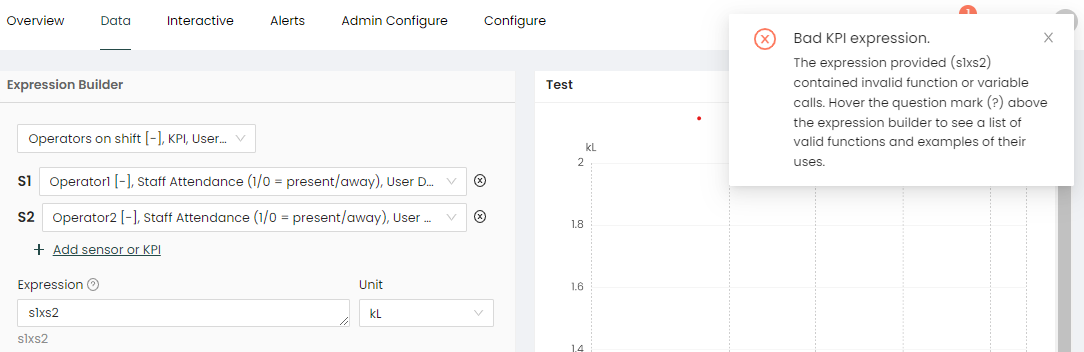
My KPI does not save in KPI Creator Possible reasons that could prevent a KPI from saving in KPI Creator: - invalid math in expression - capitalization of a function (always use lower case for functions) - missing parenthesis - ensure the Unit field is not left blank, enter/select the dash ( - ) this will signify no units are used for the expression.
|
|
|
|
I don't see a preview graph in KPI Creator The resultant graph in KPI Creator is dependent on conditions set in both FormBuilder and KPI creator calculations. - ensure limits are not set outside of your entire dataset or the KPI calculations will fail. The result would be either no data exists or the data exists outside of the senor limit. - ensure the Unit field is not left blank, enter/select the dash ( - ) this will signify no units used for the expression.
|
|
When changing the KPI the graph does not change Check for the following: - ensure to click the update button after revising you expression - the equation may be invalid resulting in no change to the graph when update button is clicked
|
A Raw KPI refers to a KPI that is created using unprocessed raw sensor data. This is to prevent odd fractional step values (i.e.. 0 or 1 output) of data from when the plant is off. This is in contrast to a 'cleaned' KPI that is created using preprocessed sensor data.
If a KPI has both automated and manual sensor data, the manual data backfills so that the KPI can be calculated for each of the sensor data points. This is also used for any sensor where the time bases do not align.
| Interpolation between Sensor Readings: | |
| Backfill: | Take the most recent value and apply it over the entire period up until the reading prior. |
Newly created KPIs can be saved using the “Save” button in the upper right-hand corner of the screen. This button becomes active after the KPI is named.
Editing/Uploading KPIs
KPIs can be edited by selecting the KPI from the list in the KPI builder. Once selected, the KPI parameters will appear in the Builder and can be edited there. You must Save the edited expression after editing by clicking on the “Update” button.

Deleting KPIs
KPIs can be deleted by selecting them in the KPI list and then pressing the Delete button.

KPIs can be copied by selecting the “Base on Existing KPI” feature when creating a KPI. This will copy the prior KPIs parameters into the expression builder. Copying KPIs is useful for generating multiple KPIs for different similar assets such as various stages in an RO train or similar pumps in different trains.

