The following are some examples of typical KPI's that can be created using the KPI Creator tool:
Pump Power from pump flow and pressure
Daily Chemical Cost & Consumption
The RO recovery can be calculated from two sensor measurements as shown by the formula below:
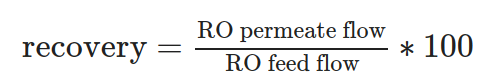
This and more advanced formulas can be performed using the KPI Creator feature.
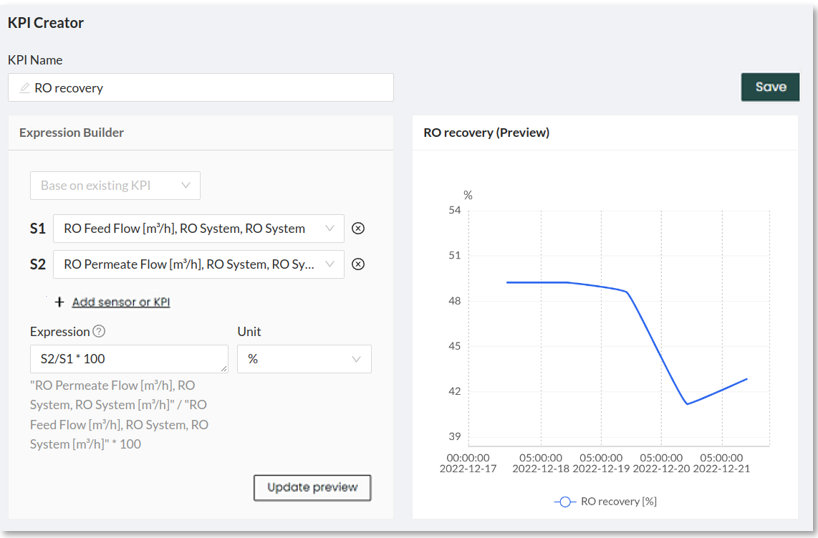
Use the dropdown bar to select the RO permeate flow and RO feed flow signals (note that your platform may have these named as something different like product flow and inlet flow). In the example below, we selected the following:
S1: RO Feed Flow [m3/h]
S2: RO Permeate Flow [m3/h]
To apply the formula, we can use the Expression bar. In this case, the Expression is
S2/S1*100 which replicates the formula above. The Unit % is selected.
The Update preview button can be used to preview the KPI
Do not forget to press the Save button to be able to see this KPI later on this page as well as have it available in other features like Overview, Interactive, and more.
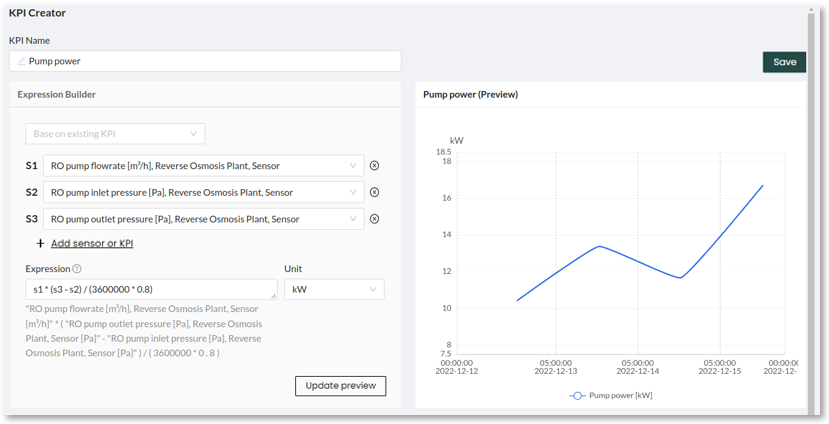
Pump Power from pump flow and pressure
The power consumed by a pump can be estimated from the flow rate, the pressure differential, and the combined pump and motor efficiency. There are a few variations of the formula, the following is one variation:
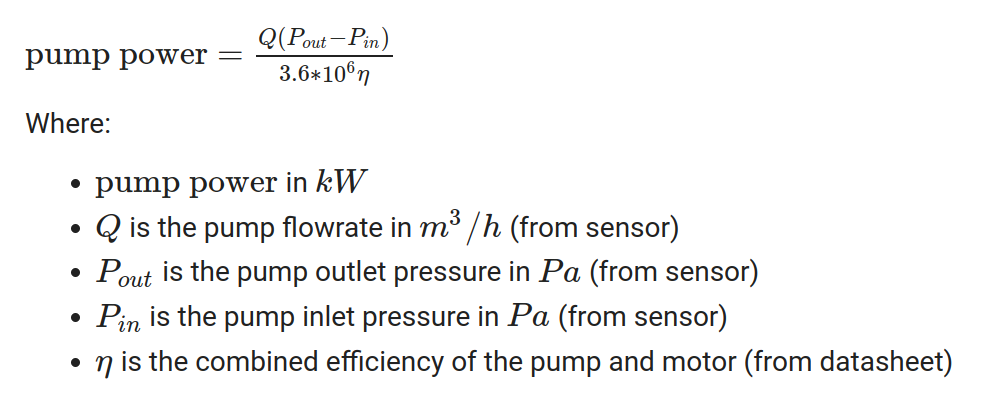
1. The 3.6*10^6 in the denominator is a conversion factor based on the units of the inputs (m3/h, Pa) and desired output units (kW). If your inputs have different units or you have different desired output units, the conversion factor will need to be different. 2. The pump efficiency extracted from the datasheet depends on the pump and motor curves. For this example, a constant value of 0.8 is used. |
Set up in KPI creator
In the KPI creator page, the formula shown above can be replicated. Users with different units can use the expression box to convert to the appropriate units.
The following screenshot shows how set this up in the KPI creator page
The daily energy consumption from an asset or process can be calculated using the following formula:
![]()
Obtaining the power of the asset or process will depend on the instrumentation available at the plant. For an example of how to estimate a pump's power from the flow rate and pressure, see the section above.
In many cases, the power will change over time due to changes to the duty cycles of the given asset. In these cases, the power term from the formula above can be replaced with the average power.
Set up in KPI creator
In this example, the pump power in kW is assumed to change over time. Therefore, the power will be averaged on a daily basis before applying the formula above. To do this the function avg(K1,1D) is used to calculate the daily average for the KPI K1 (Pump power).
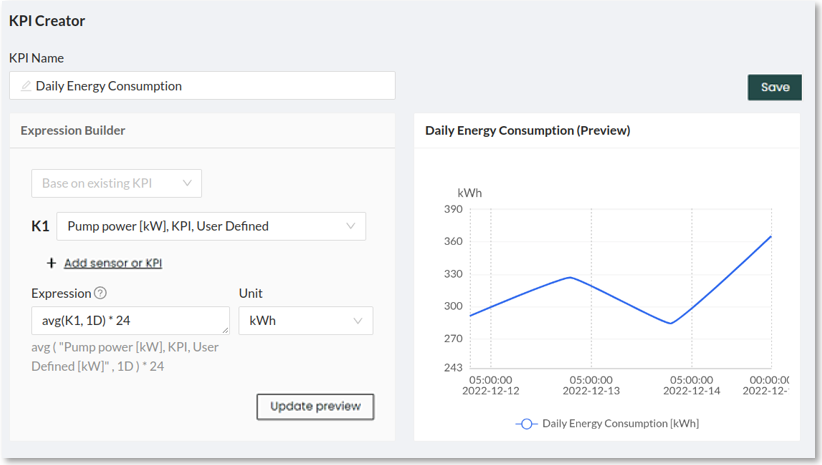
To calculate the daily energy cost, the price of electricity per kWh can be multiplied as a constant value to the expression above.
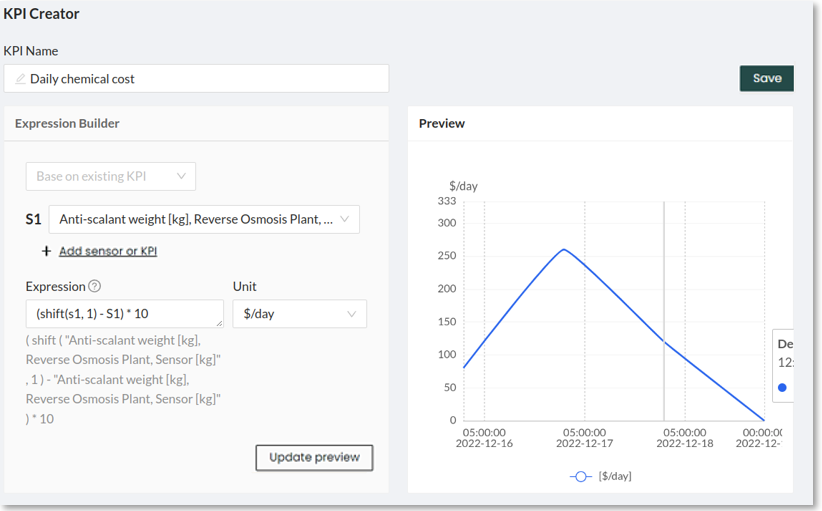
Daily Chemical Cost & Consumption
To calculate the daily chemical cost, the following formula can be used:
![]()
The chemical cost is typically a constant value while the chemical consumption can vary from day to day. There are many ways of calculating chemical consumption: from dosing pump rates, tank level differences, weight differences, and more.
Set up in KPI creator
In this example, it will be assumed that the chemical consumption can be calculated from the difference in weights from one day to the next. The expression shift(S1,1)-S1 will be used to subtract the weight of the previous day minus the weight of today (assuming the weight is measured daily).
Assuming that the chemical cost is 10$/kg, the chemical cost can be calculated as follows
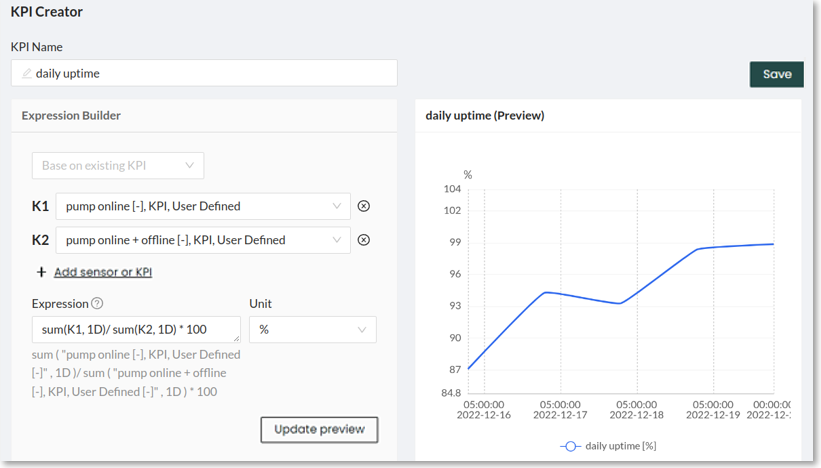
The formula below can be used to calculate the uptime of an asset or process:

If your system logs the running hours, then the formula above can be easily applied using the sum() function to totalize the number of online hours per day or week
If your system does not log running hours, then some additional logic will be required to determine when the system is online or offline. For example, a pump could be considered to be online when the flow rate through it is higher than a threshold value. To implement this logic, we will make 3 KPIs:
KPI 1: calculate online time
Whenever the pump is online, we will mark the timestamp as 1, any other timestamp will be dropped.
Use the mask function. Mask returns the values that meet a condition. For example:
pump online = mask(S1,S1>20)/S1 where S1 is the pump flow rate and the condition in this example is S1 being higher than 20 (m3/h). The mask is divided by S1 to create a signal of 1s whenever the pump is online.
KPI 2: calculate online + offline time
Whenever the pump is online or offline, we will mark the timestamp as 1.
The expression pump online+offline=S1/S1 this will create a signal that is 1 for every timestamp where the pump logged any value.
KPI 3: apply the uptime formula
Using the formula, the KPI from step 1 can be divided by the KPI from step 2. The sum()
function can be used to transform the previous KPIs into daily totals
daily uptime=sum(K1,1D)/sum(K2,1D)*100
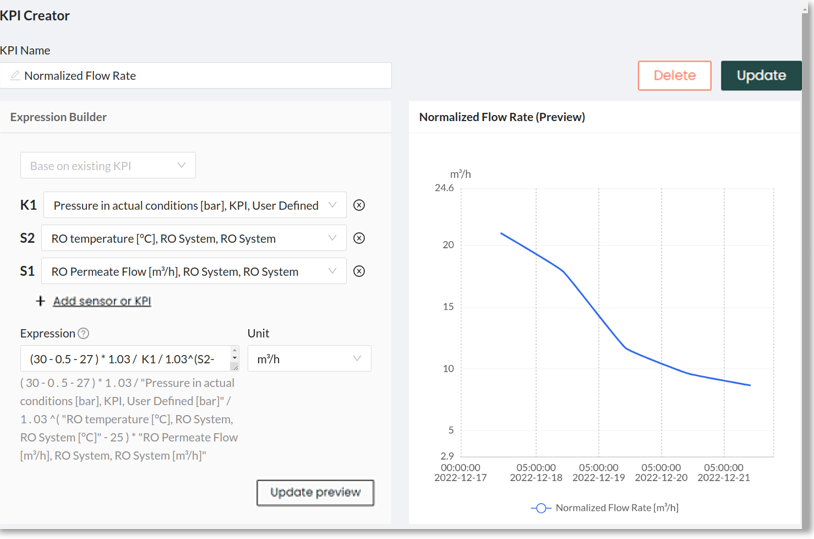
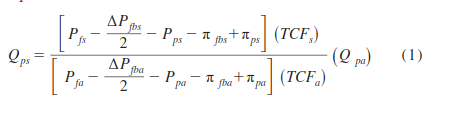
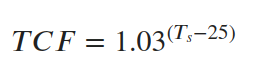
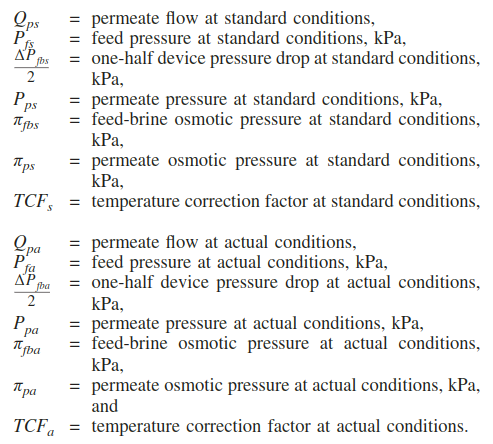
The equation for the normalized permeate flow includes multiple terms as shown below.
Set up in KPI creator
Step 1:
Note down the values of the standard conditions, these represent the earliest data logging of the membranes, usually after the membranes were installed. In our example:
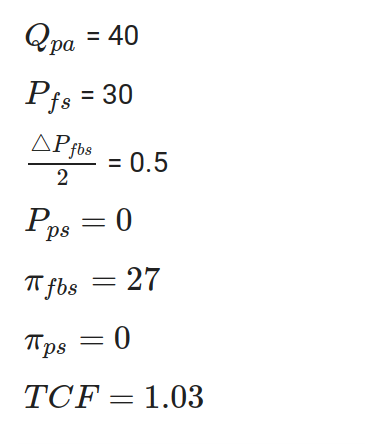
Step 2:
The pressure terms in the denominator of equation (1) are calculated and saved as a separate KPI
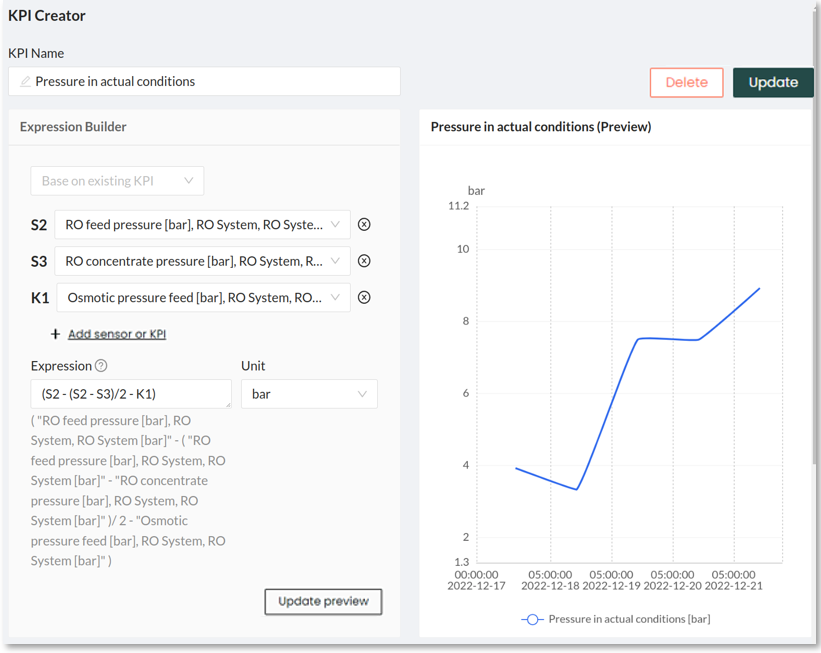
Step 3:
Now we can select the respective signals from the KPI Creator dropdown and set up the expression to replicate equation (1). We multiply the values of the standard conditions as noted down in step 1 and divide them by the pressure in actual conditions and the TCF term. Finally, the whole expression is multiplied by the flow rate at actual conditions: