
This is a collection of RO metrics that are relevant to RO engineers and members of the operations team to monitor and evaluate the performance of the RO system. These metrics can be calculated using the DIY KPI feature and linked to Overview to make a dashboard that can be monitored by engineers and operators. It is recommended to keep track of these metrics to estimate the improvements in energy costs, chemical costs, maintenance, performance, and compliance.
Energy Cost and Consumption
- RO specific energy consumption
- Pump power from pump flow and pressure
- Daily energy consumption of an RO train or RO system
- Daily energy cost of an RO train or RO system
RO specific energy consumption: the energy consumed per volume of product water produced. Typical units: kWh/m3
Chemical Cost and Consumption
- Daily chemical consumption
- Daily chemical cost
- Specific chemical cost
For additional information on this section click here.
Maintenance
- Uptime
- Daily running hours of equipment
- Running hours of the RO train since the last cleaning or replacement
- Cartridge filters consumed in the last month
- Other totalizers such as total flow treated since the last maintenance
Uptime: percent of the time that an asset or process is online for a given period. For example:

RO Performance
- RO Recovery
- RO Salt passage
- RO Pressure drop
- RO normalized metrics
RO Normalized Metrics: These metrics allow engineers and operators to compare the performance of the RO membranes to a baseline. The baseline is usually set by recording the data when the membrane was recently installed or cleaned. The normalized metrics account for temperature, conductivity, flow, pressure, and more external factors.
The equations for each normalized metric were extracted from the ASTM standards and are shown below:
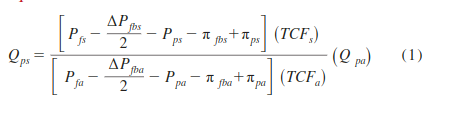
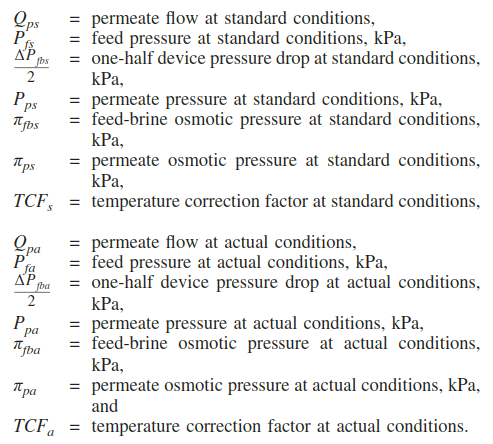
1. Normalized Permeate Flow
For TCF, the following equation can be used:
![]()
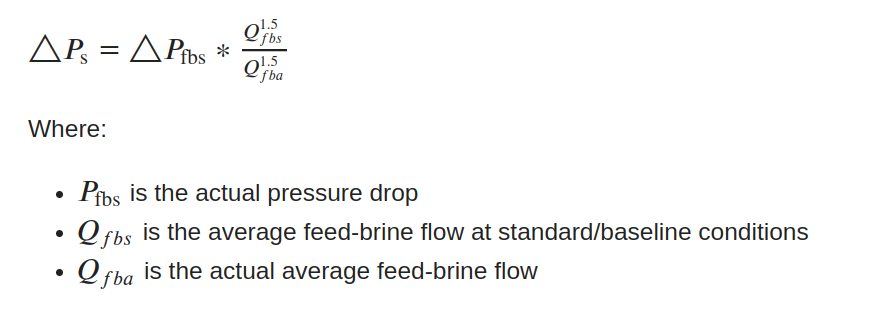
2. Normalized Pressure Drop
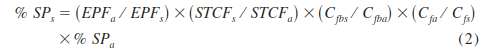
3. Normalized Permeate Salt Passage
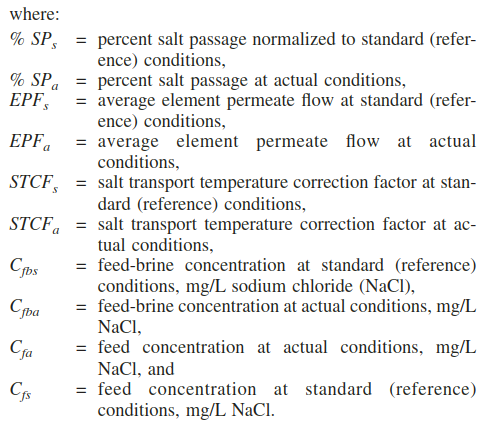
For STCF, the following equation can be used:
![]()
Production and Effluent Compliance
- Calculate TDS from conductivity
- Daily average feed TDS
- Daily average permeate TDS
- Monthly permeate water produced
- Daily feed water consumed
- Daily concentrate water discharged
- Volume of water out of compliance

