Depending on the amount of data selected you may not be able to see it all at once, as there is a cap on the amount of datapoints that can be displayed at a time (around 9k). Ensure the following when viewing your data:
1. Select a date range close to the data you wish to be displayed. Example: 2022-10-12 to 2022-10-13.
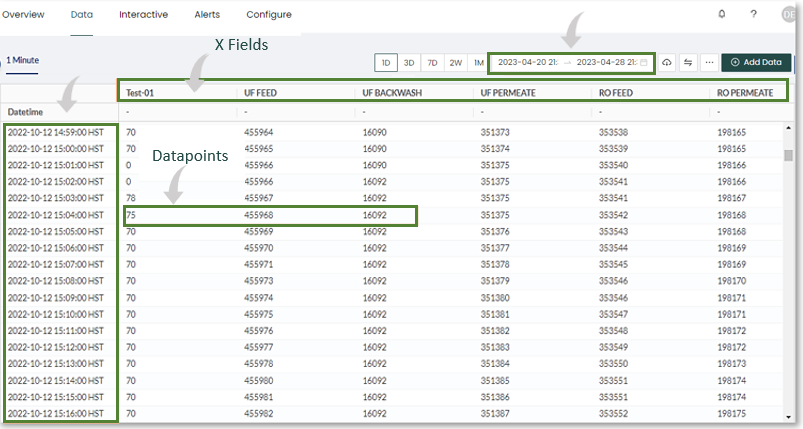
2. If the data you wish to display is minutely data (once every minute) it is important to consider this when selecting a date range.
For example, if your selected data range is 5 days of minutely data with a datapoint cap of around 9000 and a workflow of 6 (fields, sensors), you would only be able to display (9000/6/60 =) ~25 hours of data at a time. All the data is still there, you can only display a portion of it at a time.
3. When selecting date ranges for a CSV download, all selected data may not be displayed on screen due to these limitations but will be present in the downloaded CSV file.