DIY Forecasting is an optional add on to the BASE tier, which allows you to perform your own forecasting by manually inputting information into the platform.
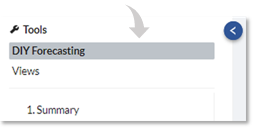
By default, "DIY Forecasting" is selected in the Tools menu, and existing forecasting blocks displayed when the platform is launched on the Overview page.
About DIY Forecasting
Clicking on the "About DIY Forecasting will present you with the following Information on its usage:
How does DIY Forecasting work?
DIY Forecasting allows you to select a signal and how many days to forecast. A model will then automatically fit to the recent data and produce a forecast. The forecast will update daily.
Why am I not seeing a forecast?
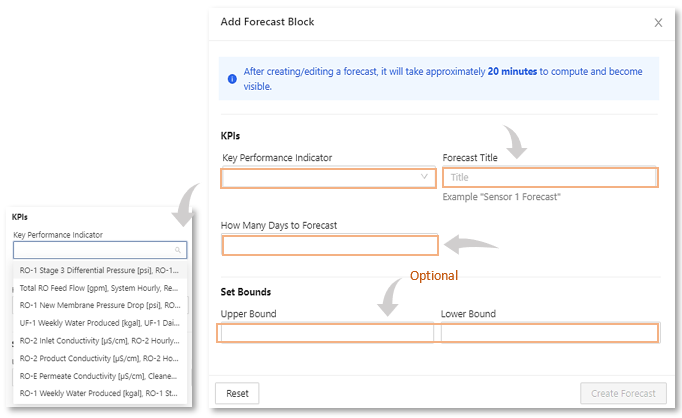
If the forecast was created or edited recently, it will take approximately 20 minutes to compute and become visible.
A forecast may fail to generate if there is insufficient recent data, the data is too sparse or there is no data in the past couple days. A warning will be displayed on the forecast block in these cases.
How accurate are the forecasts?
Confidence bounds are displayed to indicate how accurate the forecast is predicted to be. Large confidence bounds indicate that there is significant uncertainty in the forecast, as it may not be reliable. Uncertainty can be caused by state changes, anomalous data or trends that the model is unable to capture.
What types of signals should I choose to forecast?
The forecast looks only at the selected signal, so it will not be able to account for changing operating conditions or move in tandem with other signals. Care should be taken when selecting signals for forecasting, to ensure that their trends are able to be sufficiently captured without additional context. At this time, the feature only provides linear forecasts, so if your signal is not well captured by a linear trend, it may not be an appropriate choice for now.
How to create a Forecast
First ensure "DIY Forecasting" is highlighted in the Tools menu on the left side of the screen. Then unlock the slider next to the "Add Block" in the upper right of the main screen as shown below:
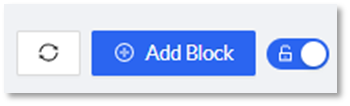
![]()
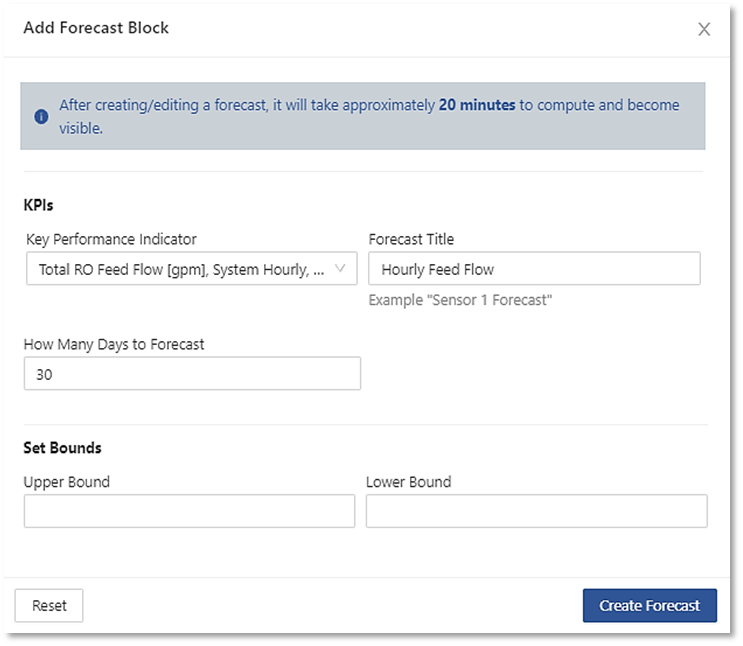
Click "Add Block" to launch the "Add Forecast Block" setup window.
|
Steps for adding a DIY Forecast is as follows: Step 1: Select a KPI from the available selection in the pull-down menu you wish to use in your forecast. |
Viewing the Forecast Block
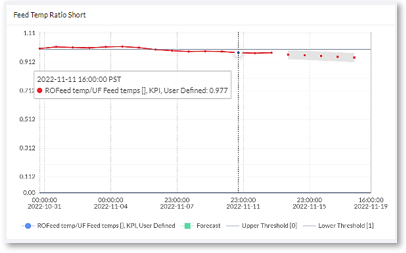
Once your forecast block has been created and displayed on the Main screen, you are provided with daily updated data on your forecast.
The forecast is based on how this signal has behaved in the past and displays how you might expect it to behave in the future, and only takes into account the selected KPI signal.
Text displayed includes the Forecast title, relevant information about your forecast presented using a color-coded legend for reviewing the graph.
You can resize your forecast block with the sizing corner on the bottom left of the block and reposition its location by dragging the block. This allows you to fit multiple forecasting blocks on the main screen.
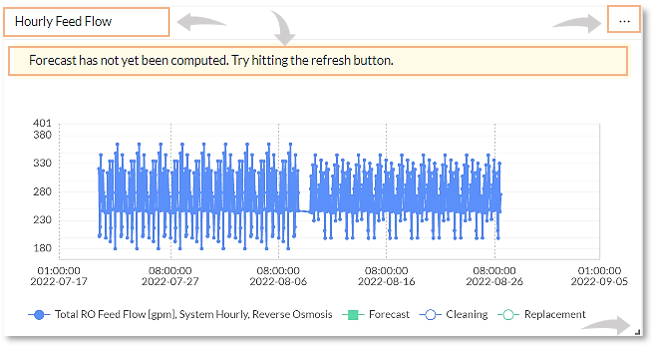
You can edit an existing forecast block by clicking on the "..." dots and selecting "Edit".
|
|
All of the fields in the “Add Forecast Block are now available for reviewing or editing. This allows you to adjust the settings to optimize your forecast of the selected KPI signal, as shown below: