
Best Practices for RO Operation and Data Collection
This document is designed to assist the user in best practices to implement in operation and data collection taskings.
|
The following conventions are used throughout this document and are described below:
|
The RO Best Practices that are associated with the Water Plant Engineer are outlined below. These tasks include the preparation of standardized log sheets, normalization of operating data, interpretation of normalized data to include direction on cleaning or replacement of membranes, troubleshooting RO and pretreatment systems to recommend appropriate corrective actions, development of maintenance procedures as needed for specific plant equipment, and selection of appropriate routine consumable items for RO operation within budget constraints.
Format Pretreatment, Daily Data, and Maintenance logs to include the following:
Since the RO system performance depends largely on the proper operation of the pretreatment, the operating characteristics of the pretreatment equipment should be recorded. Specific recommendations for all record keeping cannot be given since pretreatment is site dependent. Typically, the following items must be recorded:
- Total residual chlorine concentration in the RO feed (daily - unless known to be completely absent).
- Discharge pressure of any well or booster pumps (twice a day).
- Pressure drop of all filters (twice a day).
- Consumption of acid and any other chemicals (daily - if used).
- Calibration of all gauges and meters based on manufacturers' recommendations as to method and frequency but no less frequent than once every 3 months.
- Any unusual incident, for example, upsets and shutdowns should be recorded on daily log sheets as they occur.
Daily Operating Log
The following data must be recorded and logged into an appropriate log sheet at least once per shift, unless otherwise stated:
- Date, time and hours of operation.
- Pressure drop per filter cartridge and per stage.
- Feed, permeate and concentrate pressure of each stage.
- Permeate and concentrate flows of each stage.
- Conductivity of the feed, permeate and concentrate streams for each stage. Permeate conductivity of each pressure vessel should be recorded weekly.
- pH of the feed, permeate and concentrate streams.
- Calibration of all gauges and meters based on manufacturer‘s recommendations as to method and frequency but no less frequent than once every three months.
- Silt Density Index (SDI) or turbidity of the RO feed stream, or both. SDI testing should be performed at least monthly for systems that utilize a surface water source. For systems on Well Water, SDI testing would be indicated if normalized data indicates changes in membrane performance due to fouling.
- Water temperature of the feed stream.
- Langelier Saturation Index (LSI) of the concentrate stream from the last stage (for concentrate streams < 10,000 mg/l TDS).
- Any unusual incident, for example, upsets in SDI, pH and pressure, and shutdowns
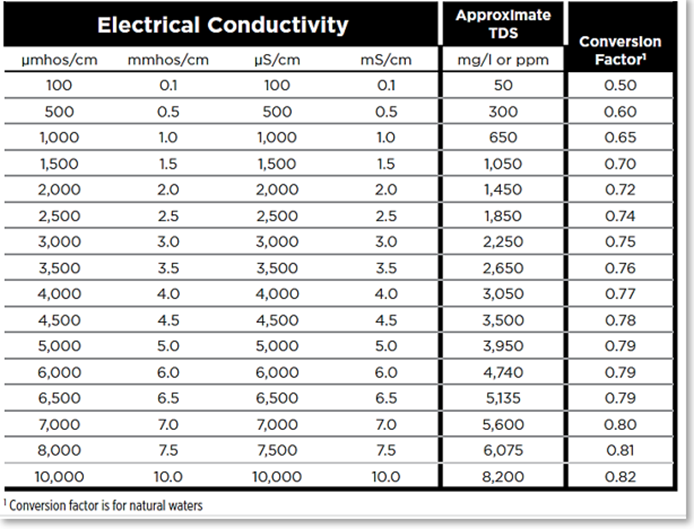
- TDS of feed, permeate and concentrate streams for each stage. If the measuring device does not calculate TDS an estimated TDS may be calculated from the measured conductivity at 25°C (EC25) and an appropriate K factor using the following equation: TDS = K*EC25. The K factor must be determined for each specific stream. Typical K factors for estimating TDS from the conductivity of water (EC25 in uS/cm) are: Permeate - (0.1 – 1), (30 – 80), K = 0.50, 0.55; Brackish water - (4,500 - 6,000), K = 0.79; Concentrate (6,500 - 8,500), K = 0.80, and Seawater (>10,000) K = 0.82. A table of K factors is presented below:
Pani’s Log Sheet feature is great for replacing paper or electronic logs. It’s integration with Pani’s Interactive and other tools on the platform provide for a deeper understanding of plant operations when things go awry. Create the form so that it flows with the Operators rounds in the plant. Customizing it to capture the Operator's name and shift times to entries, ensures the Supervisors/Engineers can follow with the actions of those on shift.
In addition to this they can now have full access to the Operator Logs remotely.
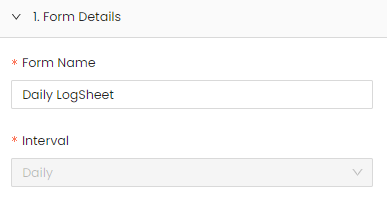
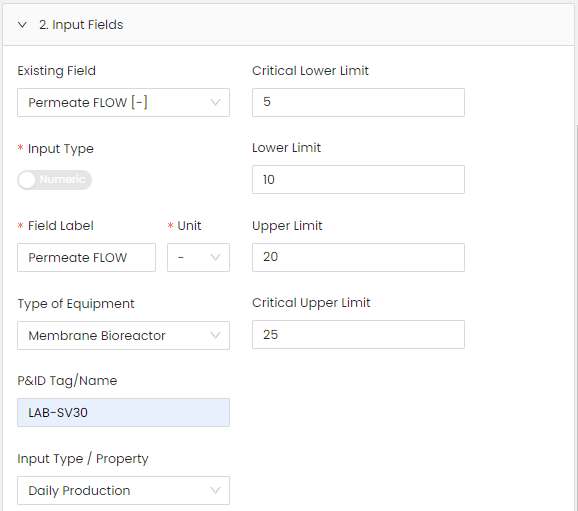
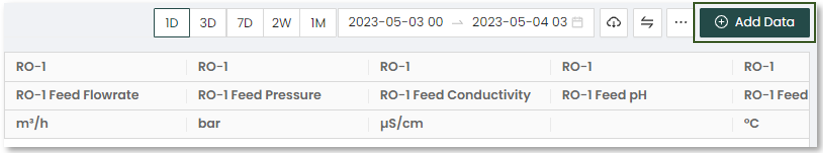
The Engineer workflow for this would be to prepare a Daily Log Sheet and populate it with existing historical data by importing it via an uploaded .CSV file or creating the Log from scratch.
|
An example for the creation of a Daily Log Sheet is shown below:
|
Maintenance Log
The Maintenance Log should be designed to capture as much of the following information as possible:
- Record routine maintenance.
- Record mechanical failures and replacements.
- Record any change of membrane element locations with element serial numbers. Membrane Serial number location in the system is recommended during the initial membrane loading and any time membranes are subsequently replaced. The membrane manufacturer and the installed model number should also be recorded for future reference.
- Record replacements or additions of RO devices.
- Record date of calibration for all gauges and meters.
- Record replacement or additions of pretreatment equipment, for example cartridge filters, and include date, brand name and nominal rating.
- Record all cleanings of RO membranes. Include date, duration of cleaning, cleaning agent(s) and concentration, solution pH, temperature during cleaning, flow rate and pressure.
The workflow for capturing maintenance data includes the following:
The Maintenance Log can be recorded either in the provided Quick Log (recommended) or a custom maintenance form prepared by the Engineer or Manager in the Data page directly on the Pani Platform.
Custom maintenance forms can be created for larger plants and may contain separate Logs for calibration (Calibration Log) and equipment runtimes (Equipment Runtime Log). An equipment log can come in handy to track run times and set a lower limit informing you when an upcoming Preventative Maintenance is scheduled.
Quick Logs are handy for recording maintenance, as they show up in other reports that other Logs do not. From a workflow perspective Quick Logs should be used as your Maintenance Log.
The Engineer or Manager may want to enter Hashtags # into the Quick Log that can be used for reference to generate keywords for current and future events. Some examples would be:
| #flow | #maintenance | #noise |
| #false-alarm | #observation | #repair |
| #heat | #pH | #resolved |
| #leak | #replaced | #operations |
These can be expanded upon at any time by entering # in front of the new keyword. As an example, for the word “Temperature” type in #temperature and this keyword will not only be associated with this event but will be available for future events as well.
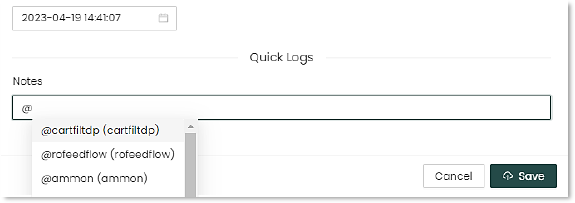
Assets can also be tagged using the @ symbol. These include things such as machinery and equipment. This allows you to create a log of issues with a particular pump, for example, and reference that in future logs. Some other examples are shown below:
| @plant/ro-system | @collection-tank | @pressure-valve |
| @sludge-watse | @power-meter | @inlet |
|
@ro-membrane |
@temp-gauge | @flow-sensor |
|
An example of a Quick Log entry in use is shown below:
|
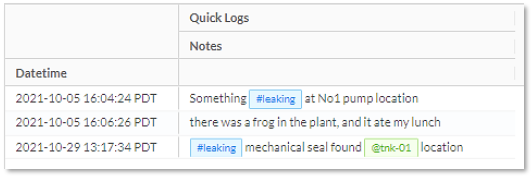

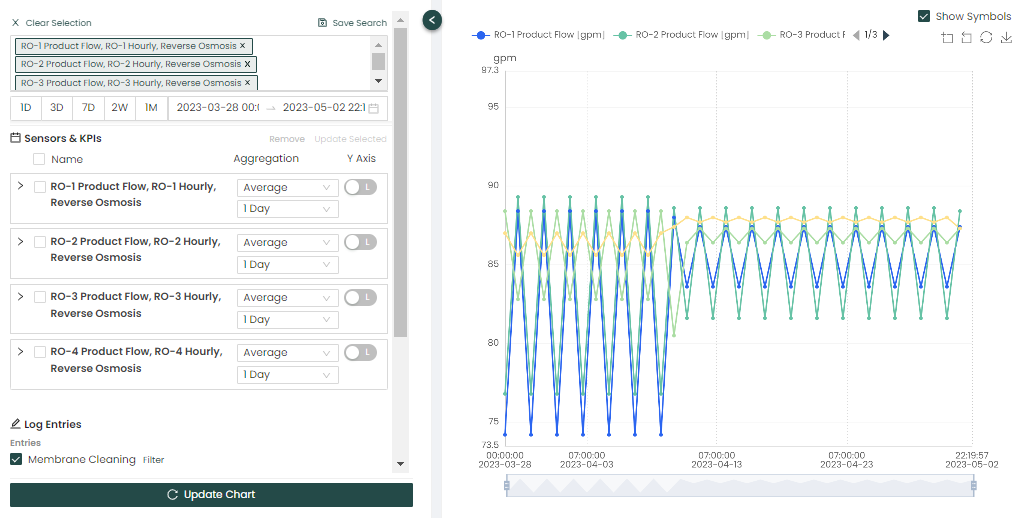
Quick Log data can also be selected to be displayed to an Interactive page, indicating any observations or maintenance activity along a given Interactive’s graph timeline.
To illustrate this the "System Flow" is plotted in the Interactive page on the Pani platform, which includes the Quick Log entry shown above.
|
An example of a Log entry viewed in Interactive:
In the example above we can see that along the graph timeline on the right, a green bar is shown indicating the Quick Log notes that were entered for that date and time. |
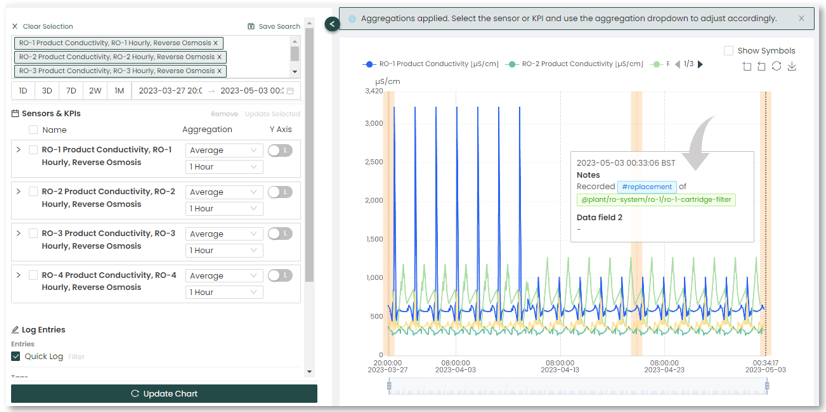
The Interactive page is used by the Engineer to perform thorough root cause analysis for troubleshooting or to assist with supporting optimization opportunities.
Monitoring Performance and Alerts/Insights
Another part of the Engineer's workflow on the Pani Platform would be to setup Alerts/Insights to be monitored by the Operator. Once an Alert/Insight is setup, the plant Engineer can input the recommended actions to take. This gives the engineer the opportunity to communicate digitally to the operator on actions that align with the SOPs or the plants best practices. Insights are normally pre-configured based on the site by Pani, but additional Insights can also be created.
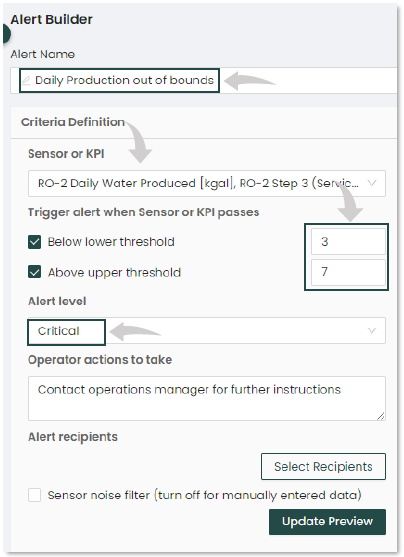
Alerts are based on KPIs exceeding user-defined thresholds. Both minimum and maximum threshold values are provided, along with options for resending alerts. For additional information on KPI's see the KPI Creator article in the Data Page section of Pani's Knowledge Base.
For the purposes of this exercise, we will set up a basic Alert on the Pani platform.
|
To create an Alert , do this:
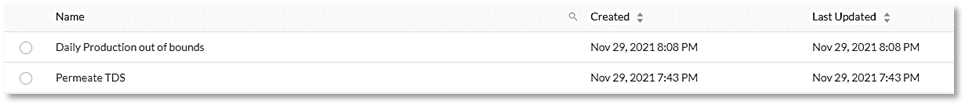
You can view the saved alert at the bottom of the screen. With the latest save at the top of the listing.
|
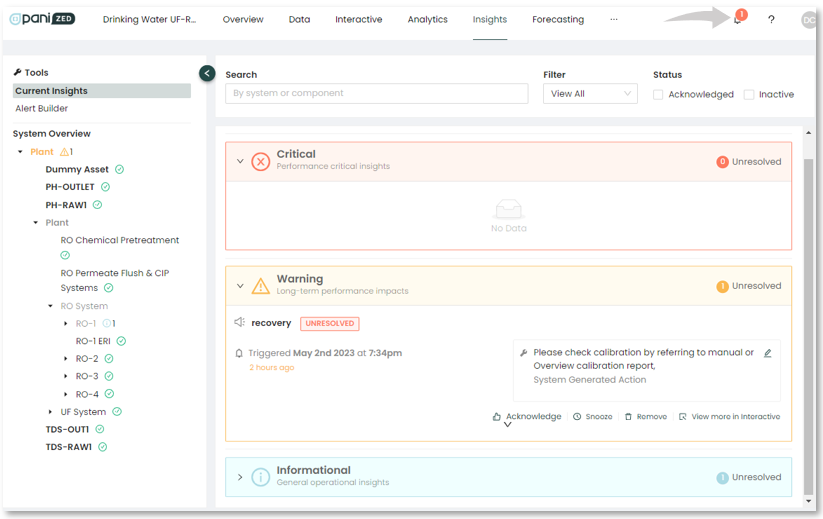
Continue to create Alerts for your processes. Alerts are a great way to keep staff informed when systems or processes exceed limits. Alerts that are triggering generate an alert notification in the upper right-hand portion of the application, instantly notifying operators that there is an item needing their attention.
Clicking on the Alarm icon will bring up a legend listing the triggered Alerts.
|
How to address Alarms/Insights being triggered is shown below:
1: Once an Alert has triggered, the Operator reviews information and recommended action.
|
Normalization
In order to distinguish between “normal” changes in performance due to extraneous factors such as feed conductivity and water temperature, and performance changes due to fouling or other operational issues, the measured permeate flow and salt passage must be normalized. Normalization is a comparison of the actual performance to a given reference performance while the influences of operating parameters are taken into account. The reference performance may be the designed performance or the measured initial performance. Normalization with reference to the designed system performance is useful to verify that the plant gives the specified performance. Normalization with reference to the initial system performance is useful to show up any performance changes between day one and the actual date. Plant performance normalization is strongly recommended, because it allows an early identification of potential problems (e.g. scaling or fouling) when the normalized data are recorded daily. Corrective measures are much more effective when taken early. Changes to normalized permeate flow are commonly calculated although changes in Salt Passage and Pressure Differentials may also be normalized using calculations contained in ASTM D-4516. Permeate flow normalization can be calculated using the following basic calculations:
QNORM = QC * (NDPSTART/ (NDPC )*(TCSTART/TCC)
QNORM = Normalized permeate flow
Where:
QC = Permeate flow at current point C.
NDPSTART = Net Driving Pressure at start up or reference condition
NDPC = Net Driving Pressure at current point C.
NDP = (Feed Pressure + Concentrate Pressure)/2) – (Permeate Pressure + Osmotic Pressure)
Osmotic Pressure = 0.011* (TDS Feed + TDS Concentrate)/2)
TCSTART = Temperature Correction Factor at start up or reference condition
TCC = Temperature Correction Factor at point C.
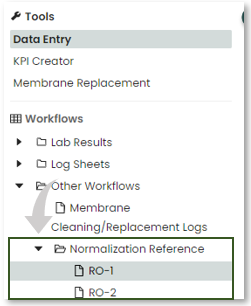
As part of the Engineer workflow, It may be necessary to add or modify the "Normalization Reference" data. This can be done on the Data Page of Pani platform.
|
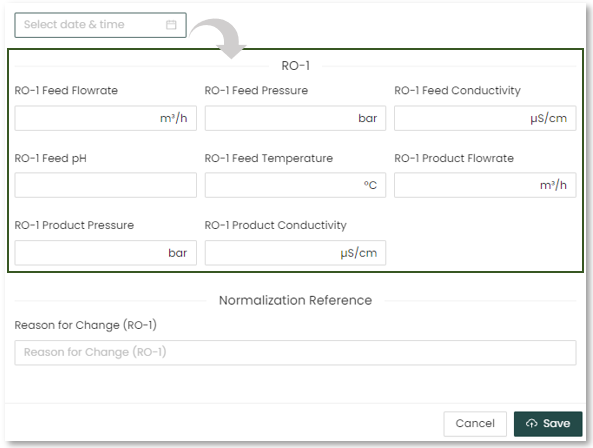
An example of how to add or modify the reference data:
The page below will pop up to manually add Normalization References. Select the date & time you wish to add, and manually input the data into the form. Click "Save" once it is done. There is also an option to upload data via "* CSV Upload" which can be found when clicking the "..." button beside "Add Data" button.
For information on importing data using CSV Upload click here 🖱.
|
Cleaning Determination
In normal operation, the membrane in reverse osmosis elements can become fouled by mineral scale, biological matter, colloidal particles and insoluble organic constituents. Deposits build up on the membrane surfaces during operation until they cause loss in normalized permeate flow, loss of normalized salt rejection, or both.
Elements should be cleaned when one or more of the following mentioned parameters are applicable: the normalized permeate flow drops 10%; the normalized salt passage increases 5 - 10%; or the normalized pressure drop (feed pressure minus concentrate pressure) increases 10 - 15%.
Delaying cleaning too long may result in an inability to restore the membrane element performance successfully. This will also increase the time between cleanings as the membrane elements will foul or scale more rapidly.
|
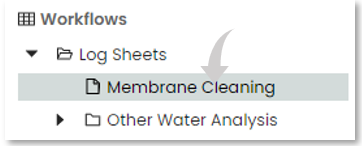
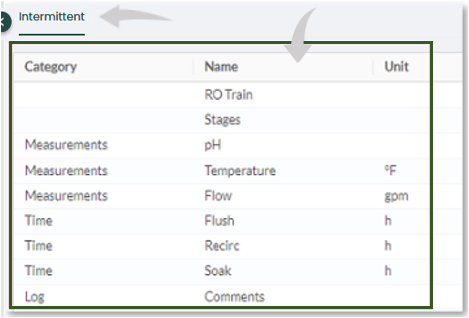
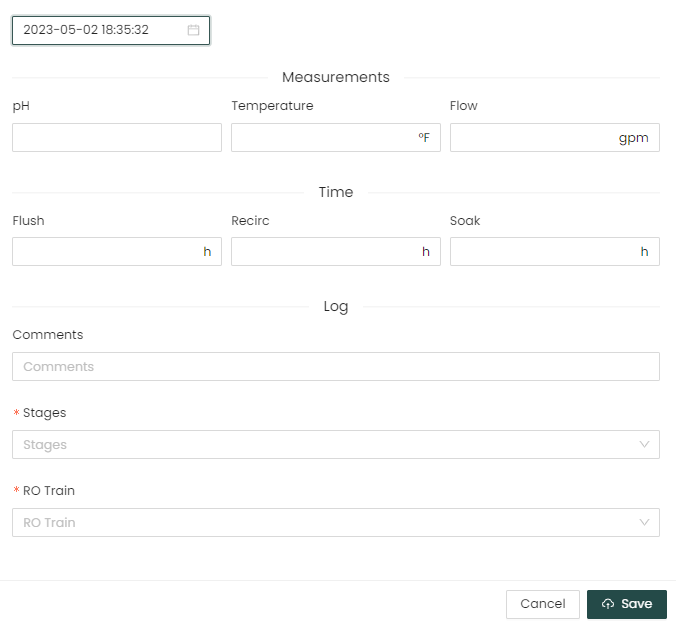
An example to create a Membrane Cleaning Log:
For more information on creating log sheets using the FormBuilder Tool click here 🖱.
|
Depending on the plant configuration and topology, additional Tools may exist on the Pani Platform to aid in the Engineer's workflow, such as Membrane Performance, , Pressure Vessel Analytics, or specific wastewater tools which are touched on below:
The Analytics feature aids in providing graphical detail for individual resources, for example selecting an RO feed pump and comparing it to other feed pumps within an RO System. This can be found on the Analytics page (included on Pani Brite and Genius deployments).
|
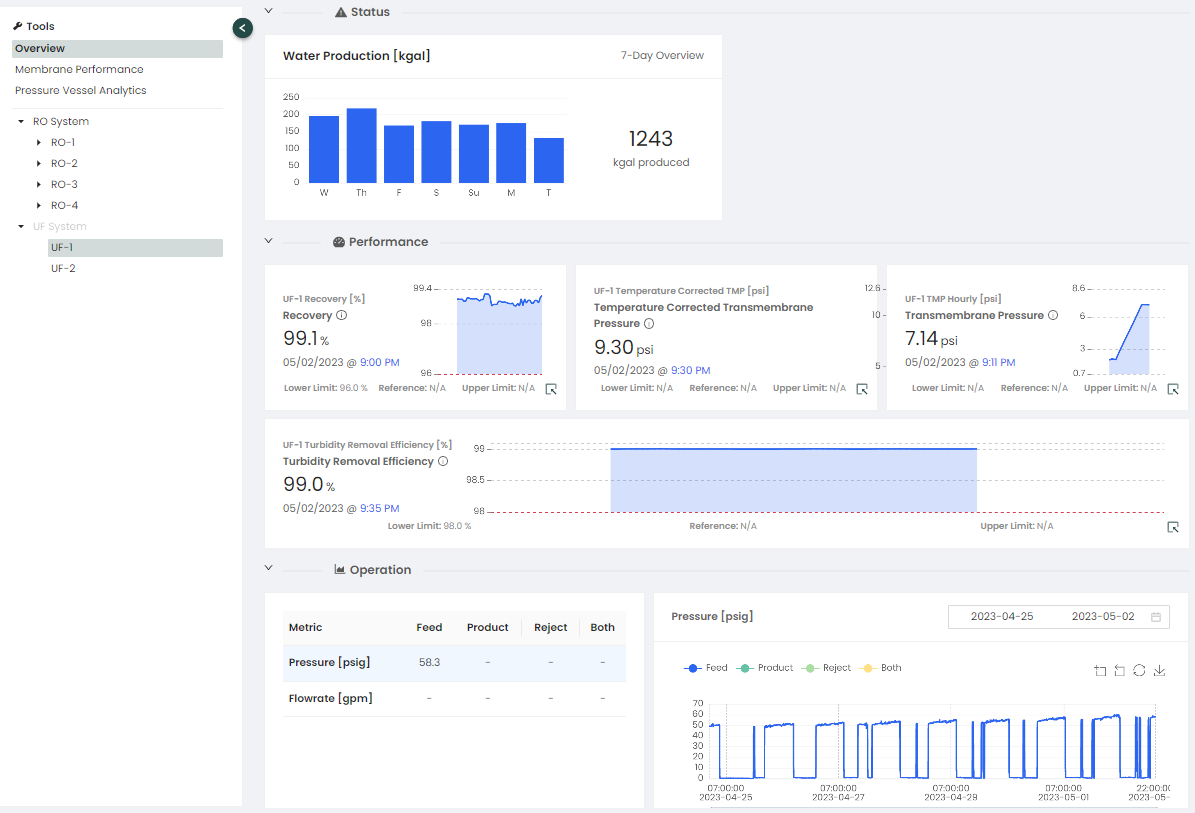
As an example, let's look at the Analytics page:
The Overview typically contains three sub-sections: Status, Performance, and Operation.
The Membrane Performance Tool used to perform diagnostics on cleaning metrics. This is done through reviewing the metrics associated with each servicing and understanding the change in key parameters since the last servicing occurred. Pressure Vessel Analytics (PVTool) allows operators and analysts the ability to manage the membrane rack, optimize replacements, and improve servicing and troubleshooting.
For additional information on Analytics click here 🖱.
|
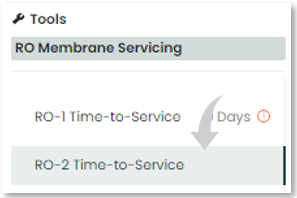
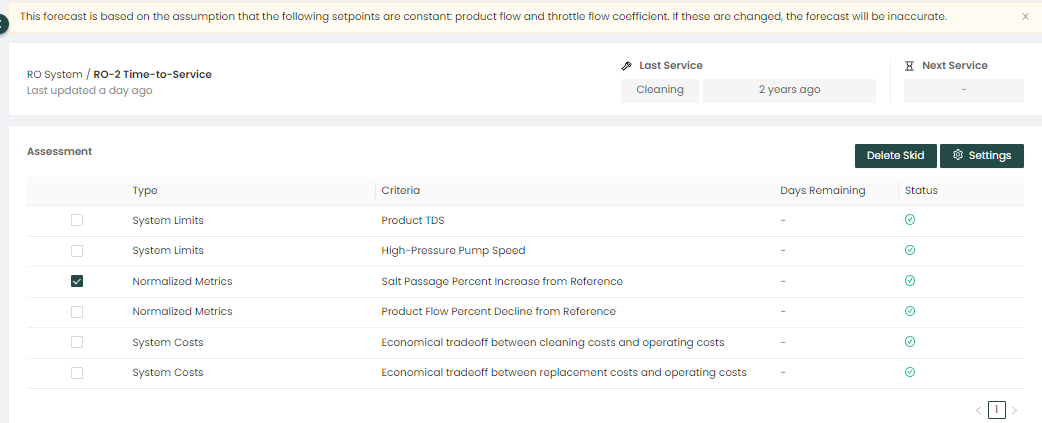
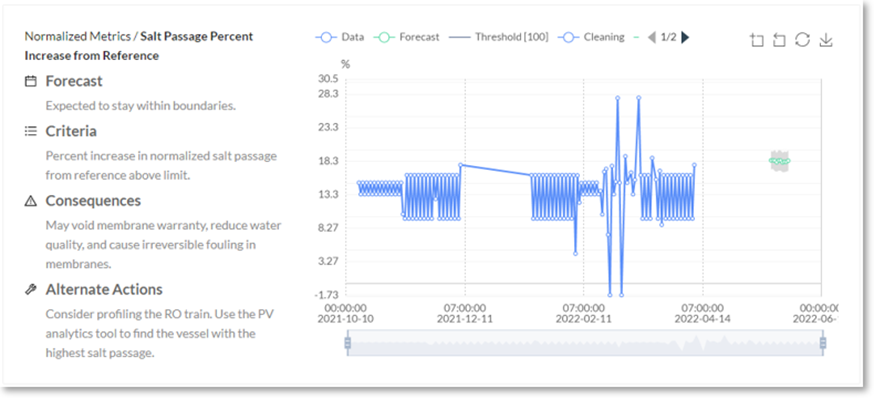
The Forecasting feature includes a "RO Membrane Servicing" tool, that helps monitor and determine when an RO system may need to be serviced. This can be found on the Forecasting page included on some Pani platforms.
|
As an example, lets look at the RO Membrane Servicing tool:
For additional information on Forecasting click here 🖱.
|
Differential Pressure (dP) should be measured and recorded across each stage of the array of pressure vessels. If the feed channels within the element become plugged, the dP will increase. It should be noted that the permeate flux will drop if feedwater temperature decreases. This is normal and does not indicate membrane fouling. Normalized data will differentiate between a change in permeate flow due temperature and those changes due to reduced temperature or damaged membrane. A malfunction in the pretreatment, pressure control, or increase in recovery can result in reduced product water output or an increase in salt passage. If a problem is observed, these causes should be considered first. The element(s) may not require cleaning. Cleaning will be more effective the better it is tailored to the specific fouling problem. Sometimes a wrong choice of cleaning chemicals can make a situation worse. Therefore, the type of foulants on the membrane surface should be determined prior to cleaning. There are different ways to accomplish this:
- Analyze plant performance data.
- Analyze feed water. A potential fouling problem may already be visible there.
- Check results of previous cleanings.
- Analyze foulants collected with a membrane filter pad used for SDI value determination.
- Analyze the deposits on the cartridge filter.
- Inspect the inner surface of the feed line piping and the feed end scroll of the membrane element. If it is reddish brown, fouling by iron materials may be present. Biological fouling or organic material is often slimy or gelatinous.
Based on the above analysis the Plant Engineer should develop a Best Practices Clean-In-Place (CIP) procedure to include proper cleaning chemistry and pH, contact times for dynamic and static solution contact, rinse times at the completion of each step, and solution disposal. In certain circumstances it may be necessary or desirable to contract an outside cleaning service to perform either onsite or remote service. Biocide application as an additional step may be added in situations where microbial growth requires management.
Silt Density Index (SDI)
The SDI is an on-site measurement of the suspended solids concentration in the feed water. It should be used to monitor the performance of the pre-treatment equipment. SDI measurements should be made pre and post multimedia filters and post cartridge filters. Details on the SDI procedure can be found in ASTM - D 4189 – 82.
- Pre¬treatment should be controlled efficiently using the designed flow rates and differential pressure limits for back-washing of the multi-media filters and replacement of cartridge filters to give an SDI before the membranes of < 3.0. A SDI < 5.0 for the RO feed water should always be maintained.
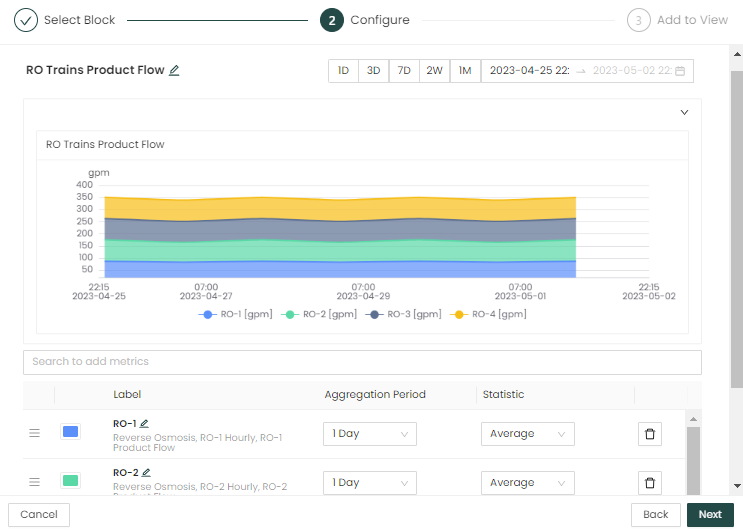
A block view can be created by the Engineer on the dashboard where this can be monitored by the Operator in the OVERVIEW page of the platform.
|
As an example, to create a Block View, do this:
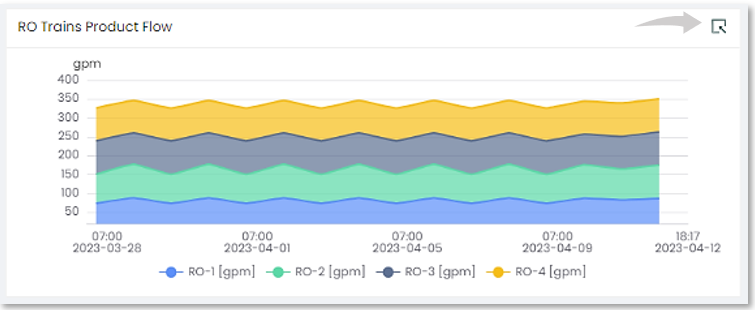
The Process Analyst can click on upper right corner of the Block, launching the INTERACTIVE page where a thorough root cause analysis can be performed.
Or capture SDI data on the platforms DATA page if not supported by a digital sensor. Use this information to set your flow rates etc. Additionally, membrane performance can be viewed on the Analytics page if available to your platform. |
Miscellaneous
All chemicals to be used on the membrane system must be reviewed by the Plant Engineer to ensure compatibility with the installed membrane type. Where incompatible chemicals are used, sufficient safeguards must be installed to eliminate or reduce their effect on membrane integrity during their application. An example of this would be the use of oxidants for microbial control and the neutralization of oxidant not consumed in the process prior to exposure to the membranes. In certain circumstances associated with the use of the produced water it may be necessary or desirable to obtain products that have specific Regulatory approvals.
Manager Daily Workflow
- Small RO system operations, generally considered to have permeate production in the range of 150K to 500K GPD (500 – 2,000 m3/day), may or may not have a Utilities Manager with responsibility for the water treatment processes.
- In most cases these responsibilities are handled by a Maintenance Manager with no knowledge of the specific operations. In these circumstances the RO knowledge generally resides with the lead operator or shift supervisor. Manager level involvement in the operation of the water plant is usually relegated to budgetary management and ensuring that there is sufficient water production volume and quality to support plant processes.
- This would include the decision to purchase new membranes as well as consumable requirement monitoring and inventory oversight.
- Decisions on altering operational setpoints to meet specific operational cost targets would be included in this level of responsibility.
- In many plants, the supervisory position (daily operational control, CIP decisions, would be delegated to the lead operator, however, longer term changes would be at the discretion and direction of the Manager.
- Plant Records are typically archived by Managers in this range of plant sizes. They also retain the original documentation for the plant’s specific equipment.
- The Manager is the primary driver for subordinate training on specific operational requirements and processes.
As part of this the Plant manager can use the Pani Platform to:
- Review Overview to ensure efficient plant operations.
- The Plant Manager can check on plant operations using their mobile device to monitor Insight notifications 24/7.
- The Plant manager coordinates with plant operators on Alert responses and implementation of Process Analyst recommendations from Playbook or Analytic studies.
- Monitor daily L1 alerts/reports for critical and information issues
- Monitor weekly L2 plant performance report and use this to communicate aggregate plant operations to executive staff (optional)
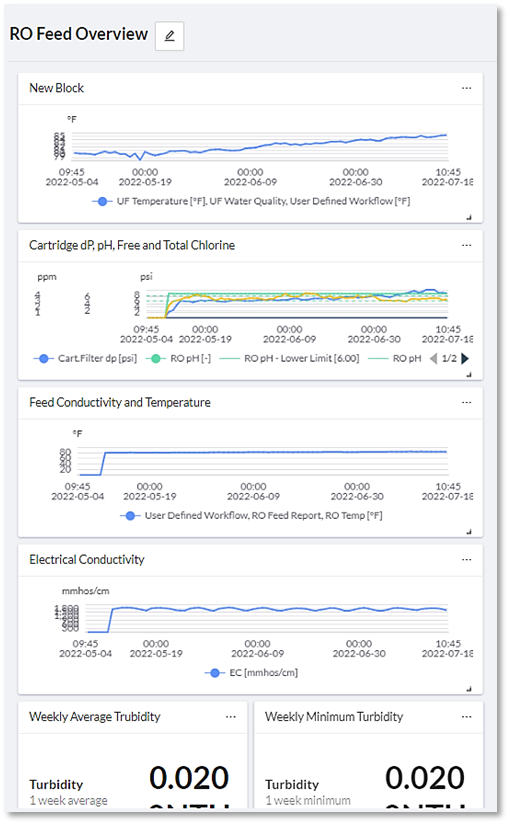
- Create an Operations Manager Weekly Report in Overview to send to senior executives.
|
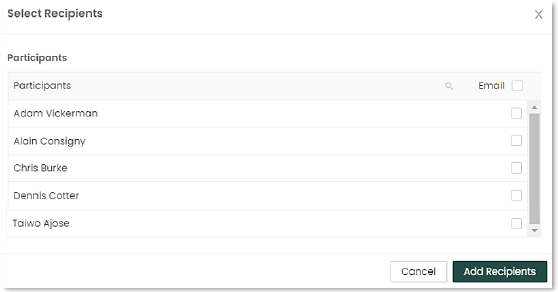
An example of how to Schedule a Report: Arrange your block views in on the selected dashboard in the Overview page so they will fit when displayed on a mobile device. Like shown below:
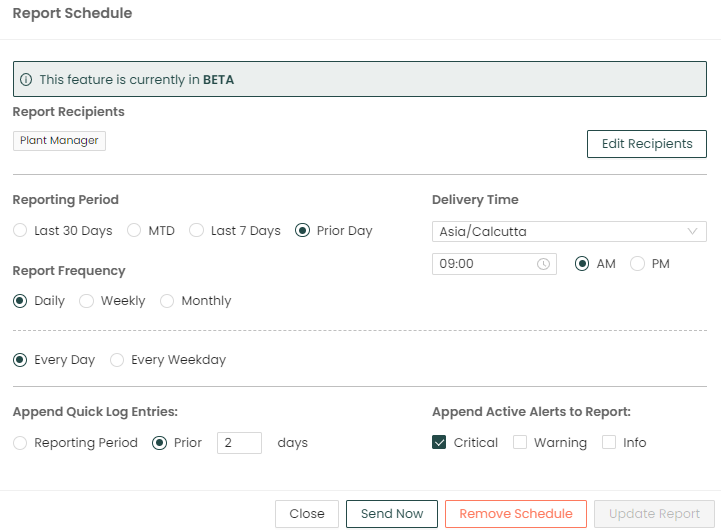
This will open the Report Schedule window to setup and customize a scheduled report to send out to specified recipients at a specified interval.
Back at the Report Schedule window, select from all of the following:
When complete, click on the "Schedule Report" at the bottom of the window. Once Scheduled you have the option to Edit, Send Now or Remove the Schedule.
For additional information on Reporting click here 🖱. |
Miscellaneous
Historical Reference for New Membrane
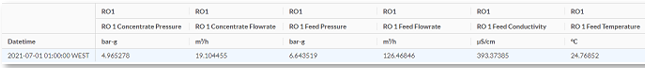
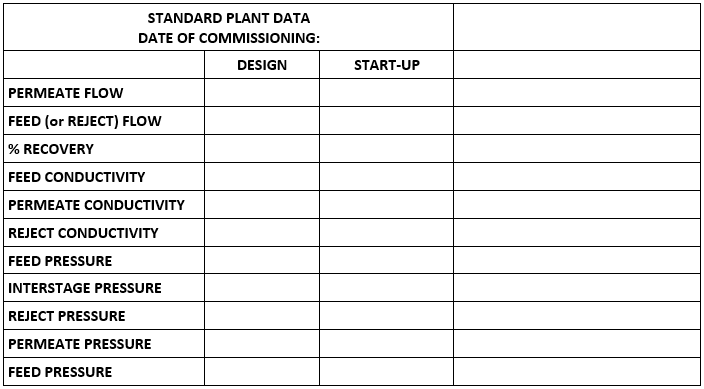
As a specific requirement, whenever a new plant is commissioned or when the system is completely refit with new membranes it is important to maintain a historical reference of both design and startup performance. The following represents the information that should be retained:
- Design data can be obtained from the membrane supplier and should be transposed from the projection sheet to the daily log sheet.
- The initial performance data gathered 24 to 72 hours after startup should be entered in this log in addition to entering it in the daily log sheets. This will allow easy reference to the original date and performance of new membranes as well as the current state of the original membrane’s performance.
- Ancillary items pertaining to the consumables should also be documented in similar fashion. This would include specific chemicals applied as well as neat concentrations and dosage, filter media type and volume for pretreatment, and cartridge filter specifications.
- Individual information such as sensor manufacturer and calibration schedules should also be documented by the Manager for future reference.
- In general, a Manager’s involvement is typically relegated to an overview on a Monthly or Quarterly basis at which time adherence to budget as well as any operational issues are identified and addressed.
The following information exemplifies the archival function of a Manager in this plant range:
Membrane System Service Workflow
For some implementations, dedicated RO or other workflows may be present. These workflows are process specific and are configured by platform.
To Summarize
The Engineer and Manager empowers the operator in the monitoring of systems and addressing issues that may arise in a timely manner based on the logs and views they create for the Pani platform.
Help Center
Need help? It’s just a mouse click away on the Platform.

Just click on the “?” icon located on the upper right corner of the screen, and you will have immediate access to the Help Center. Here you will be able to access the Knowledge base with how-to step by steps, video tutorials, FAQ’s, and more.

