
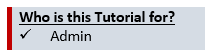
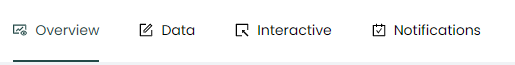
Introduction to the Platform
Pani ZED™ View and Focus are designed so that the platform administrator can configure most of the key parameters for water treatment plants, users, and reporting. You can be visualizing data within minutes, and a complete plant can be set up and configured in less than a day.
The Home Page
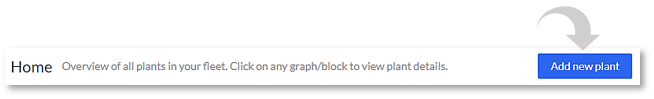
The Home page is where you will see all your plants, add new plants to your fleet, and manage user access to the platform. If you only have a single facility, you will see a single graph, or block.
What's covered in this section of the tutorial:
- How to create and add plant to the Home page
- How to add Users and create their permissions
How to Add a Plant:
Let's begin by adding a plant from the "Home" page.
1. Login to the platform with your corresponding username and password. Once you are logged in, select "Add new plant".
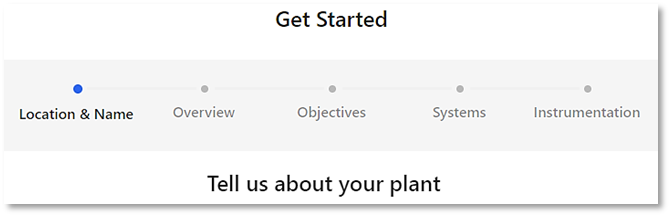
2. Follow the steps in the "Get Started" wizard to create your plant. Fill out the required fields as you move throughout the wizard.
3. Once set up, a new block will appear on the "Home" page allowing you to click into the plant and set up its forms, KPIs, and alerts. You can add more plants by going through the same steps.
- for additional information on adding Plants click here 🖱.
How to Create/Add Users:
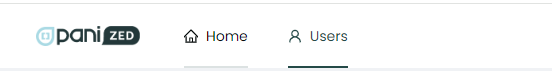
1. Log in to the platform with your corresponding username and password. Once you are logged in, select the Users tab from the upper left part of the Home page.
2. Select "Add New User". This will activate the "Invite User" pop-up wizard that walks through the setup process.
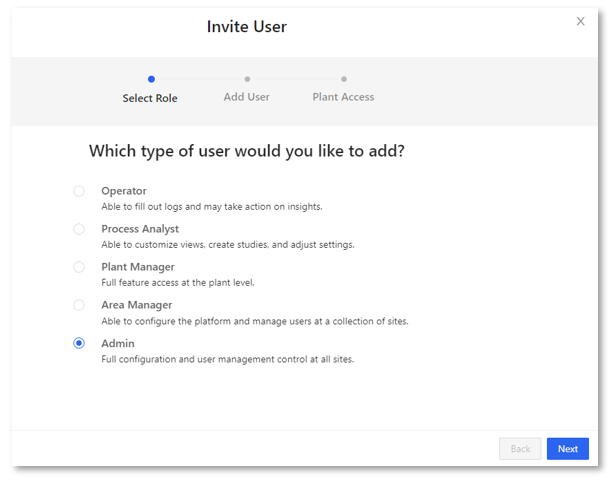
3. It's important to set up the Admin role first. This is key because the Admin needs to accept the Terms & Conditions for the company; without this step, new users will be unable to access the platform, and will instead see an error message that the company terms have not been accepted. You can add as many users as you want after this by going through the same process. You can also limit their access to various screens, feature editing, and creation capabilities by choosing the type of user.
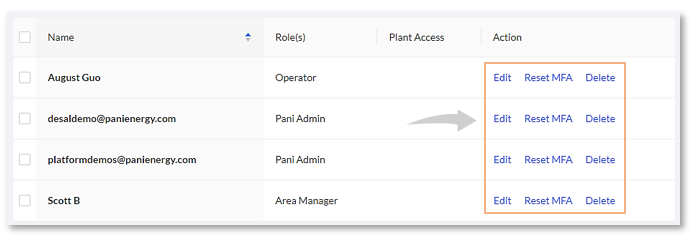
4. Edit or delete users by clicking the intended action on the right side of their names.
- for additional information on adding and setting up User roles click here 🖱.
- for additional information on The Home page click here 🖱.
Lets review what was covered before moving on to the next section
- We created and added a plant to the Home page using the "Get Started" wizard
- We learned how to add Users , assign their roles, and access to the platform using the "Invite User" wizard
The Data Page
The "Data" page allows plant operators and administrators to capture manual data regarding plant operations. Additionally, the "Data" page is where much of the plant’s reporting and sensor data is set up and consists of Workflows/Log Sheets, Forms and KPIs.
Before we can configure the "Overview" page, we need to setup our workflows, and forms that will get manual data into the system’s database to drive our KPIs.
What's covered in this section of the tutorial:
- How to create a Log Sheet using FormBuilder
- How to input & edit data Log entries
- How to create KPIs in KPI Creator
How to Create Log Sheets:
Log Sheets are a subset of workflows and are designed to capture operator input regarding operating conditions or issues at a plant.
1. Login to the platform with your corresponding username and password. Once you are logged in, you will select the plant from the dashboard you wish to modify.
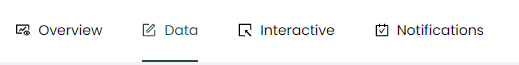
2. Select the "Data" page from the menu, ensuring that "Data Entry" is selected in the Tools sidebar.

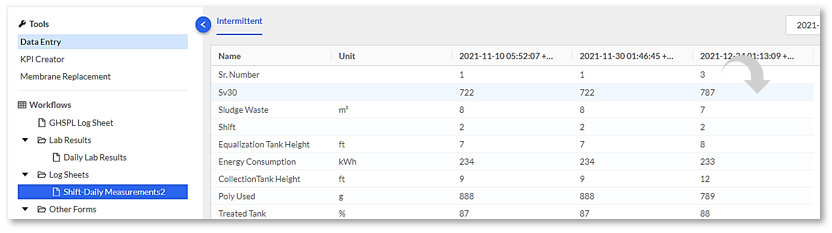
3. Locate the "Log Sheets" folder under the "Workflows" in the sidebar, where you can select any existing Log Sheet. Depending on the plant’s configuration, the options may vary.
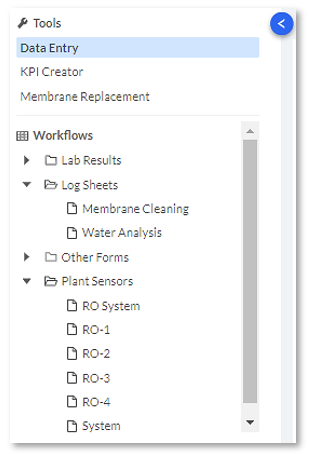
4. You can also create a new form by using the FormBuilder. This feature will help personalize your Log Sheets, depending on what is helpful and efficient for your plant.
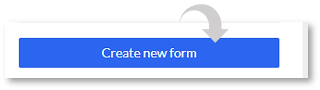
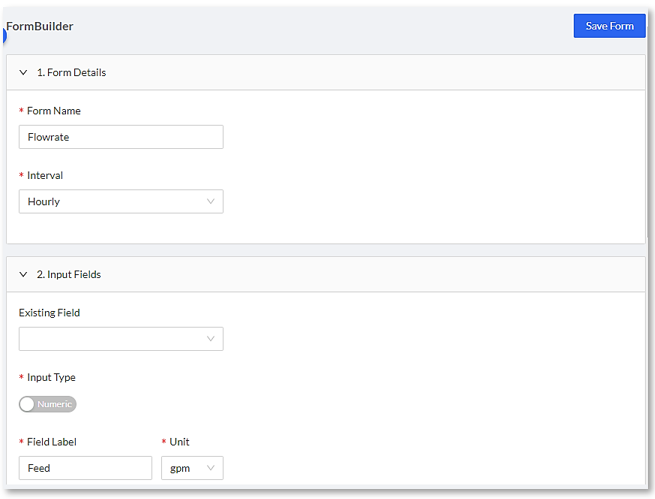
5. To do this, select "Create new form" from the bottom of the sidebar. This will launch "FormBuilder" presenting you with a blank form which to name, set the use interval, and create fields for your form.
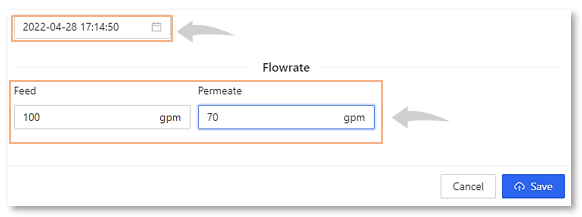
In this example, the Feed, and Permeate, are the fields added to a customized "Flowrate" form, with a specified interval of "Hourly".
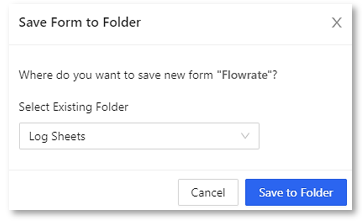
6. Once done, Save the Form created to the appropriate folder if any.
-
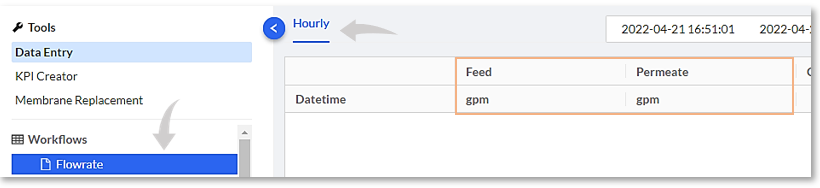
7. Once the form is available to use, you can now add data to these forms.
How to Input/Add Log Entries:
Now that you have created a Log Sheet lets input some information into your log.

1. Select the Log you want to add a log entry and click "Add Data" button. In this example we selected the "Flowrate" Log. The data entry form will open.
2. Select the date and time, and fill in the fields into the Log, and "Save".
How to Edit existing data:
In this scenario we want to edit the data in an existing log.
1. To edit existing data, select the Log Sheet you want to edit, then double click on the entry you want to edit.
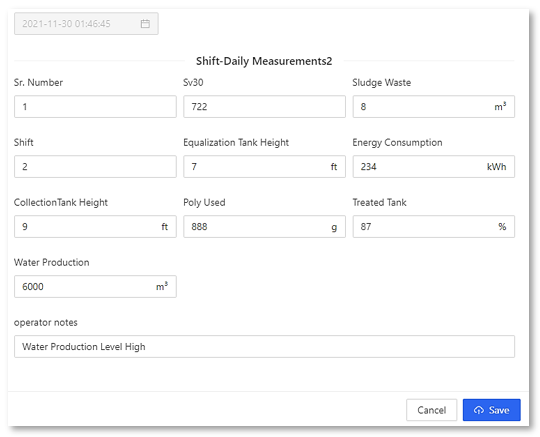
2. The data entry widow will open to the selected data for editing. Once you have edited your data, click the "Save" button.
3. To edit the Sheet itself click on the ![]() button, and select "Edit Sheet".
button, and select "Edit Sheet".
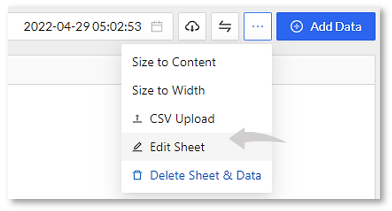
This opens you Log Sheet in "Form Builder" where you can edit existing fields in your Log Sheet or add additional "Input Fields" to your form.
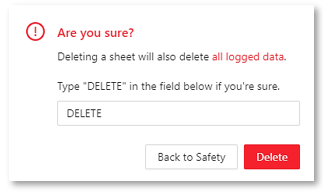
4. You can easily delete any sheets that you wish by clicking the ![]() button and selecting "Delete Sheet & Data" . It will prompt you to verify if you want to completely delete the sheet and all its data; type DELETE.
button and selecting "Delete Sheet & Data" . It will prompt you to verify if you want to completely delete the sheet and all its data; type DELETE.
- for additional information on using Form Builder click here 🖱.
How to create KPIs using KPI Creator:
KPI’s are Key Performance Indicators used to monitor the health and performance of your plant. KPIs are used throughout the system to generate reports, graphs and trigger alerts.
A KPI can be a single sensor reading; single/multiple sensors with arithmetic operations that calculate new metrics; or a combination of 2 or more KPIs.
Here we will create a simple KPI. In order to have data from which to draw upon to create our KPI, we first need to have created the forms for our plant. Sensors, log sheets, etc., as was discussed in the previous section.
If you have either Brite/Genius levels of the platform, most sensor information would have already be generated, based on the level of automation in you plant.
To create a KPI, do the following:

1. Login to the platform with your corresponding username and password. Once you are logged in, you will select the plant from the dashboard you wish to modify.
2. Select the "Data" feature from the menu and add select "KPI Creator" from the left side of the page.
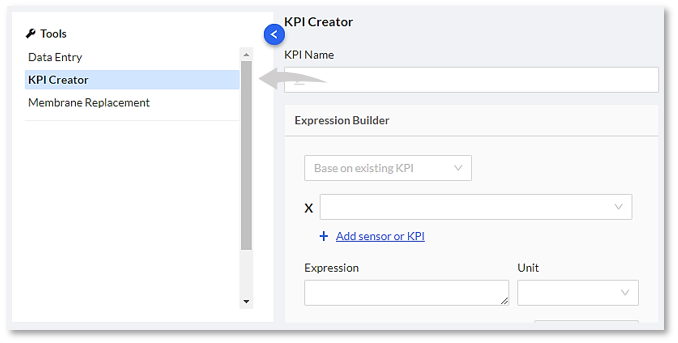
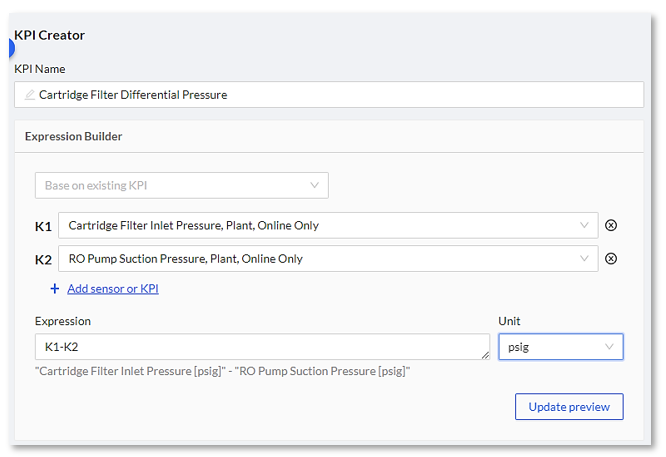
3. Fill in the KPI Name and add the sensor/s or existing KPI/s that would be required to build the "Expression". In this example, we can find the differential pressure by subtracting the two pre-existing pressure KPIs. Click "Save". Basic operations (addition, subtraction, multiplication, division), parentheses, exponents, logarithmic, square root (sqrt), natural logarithmic, filtering, etc. are the operations available to use.
4. You can create as many KPIs as you would like. It is also possible to build on a KPI you have previously configured by using the "Base on existing KPI" feature. This could be helpful when you need to create multiple KPIs with a similar expression, or KPIs with similar inputs.
- for additional information on KPI Creator click here 🖱.
- for additional information on The Data page click here 🖱.
Time to review what was covered before moving on to the next section
- We created a custom Log Sheet using the Form Builder Tool
- We learned to lnput & Edit data Log entries
- We created a basic KPI using KPI Creator
The Overview Page
The "Overview" page is where data is visualized and presented for analysis and action. In Overview users have access to pre-built dashboards, or Views, and have the option to create personalized or customized Views. A View consists of one or more blocks whose function is to display data from sensors or KPIs.
What's covered in this section of the tutorial:
- How to add a customized View or Dashboard to the "Overview "page
- How to add a "Block" to your View that will display sensor or KPI data
How to Setup the Overview Page:

1. Login to the platform with your corresponding username and password. Once you are logged in, you will select the plant from the dashboard you wish to modify.
2. Select the "Overview" page from the menu and select "Add View" from the sidebar menu. A "New View" will be created.
3. Click on the "New View" to make it the active view that will be displayed on the main screen.
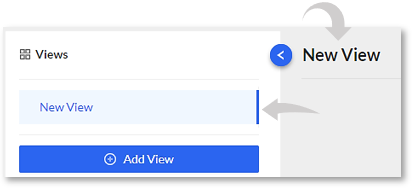
From here you will be able to create and populate your "Blocks" from which to view your data.
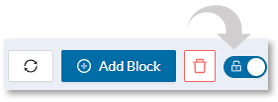
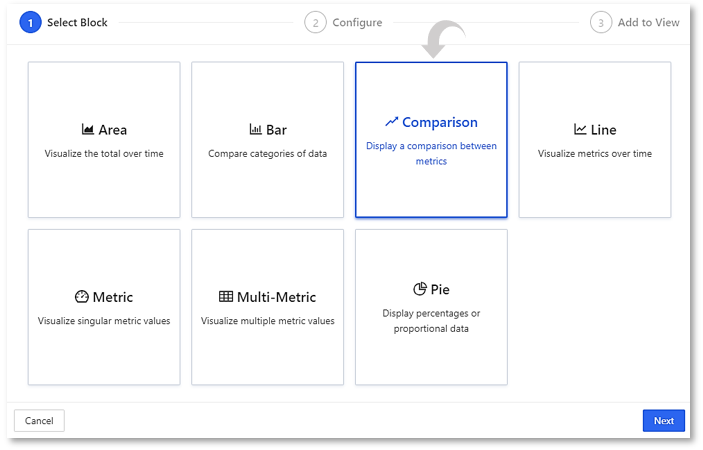
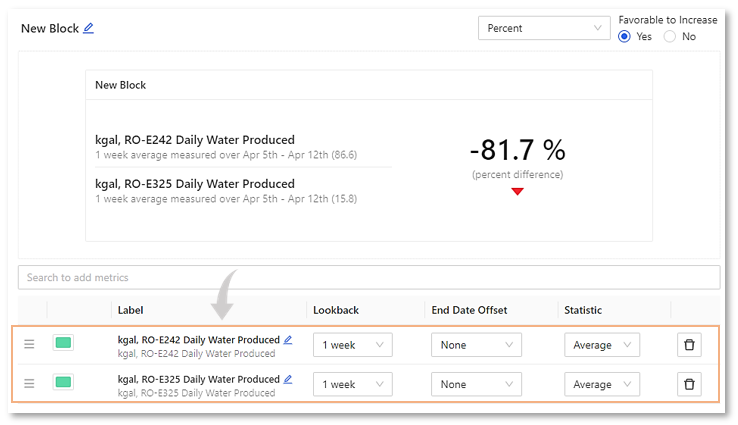
4. Select the "Add a Block"; and select the type of block you want to create, in this example "Comparison" is selected. Ensure you toggle the lock option to add/edit any blocks.
-
for additional information on adding blocks to Views click here 🖱.
5. Select the sensor/s or KPIs that is relevant for the block you just created. In this case a comparison of daily water production percentage differences between two RO trains.
6. You can create as many blocks and views that would be relevant and useful for your plant.
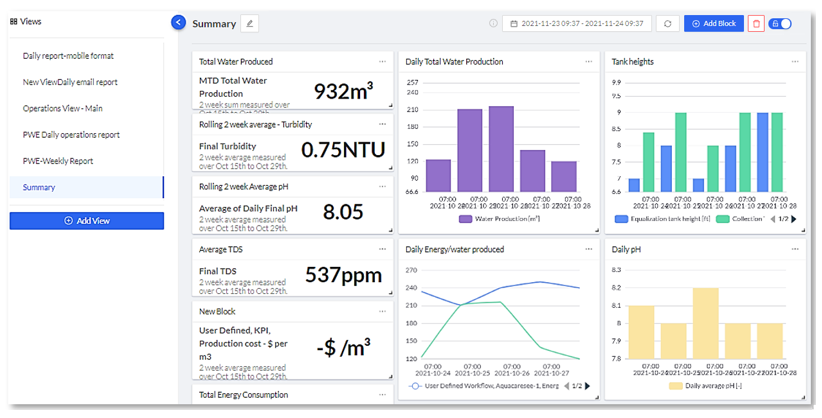
In the "Overview" page below, there are 6 Views, each with its own defined set of Blocks. The active "Summary" View displays its "Blocks" of data in various formats.
- for additional information on the Overview page click here 🖱.
Lets review what was covered before moving on to the next section
- We added a View to the "Overview" page where we could populate it with customized data Blocks
- We learned how to select, configure, and add Blocks to our View that will display sensor or KPI data
The Interactive Page
"Interactive" is a tool used to perform thorough root cause analysis for troubleshooting or to assist with supporting optimization opportunities.
What's covered in this section of the tutorial:
- How to search for assets (sensors) that we may wish to examine
- Selecting a date range for performing root cause analysis
- Selecting Sensors/KPIs and set the Aggregation & Y Axis for creating a graph
Before we begin, remember It is important that your sensors and KPIs are setup in the Data page prior to using "Interactive".
How to search for Sensors/KPIs:
1. Login to the platform with your corresponding username and password. Once you are logged in, you will select the plant from the dashboard you wish to modify.
2. Select the "Interactive" feature from the menu.
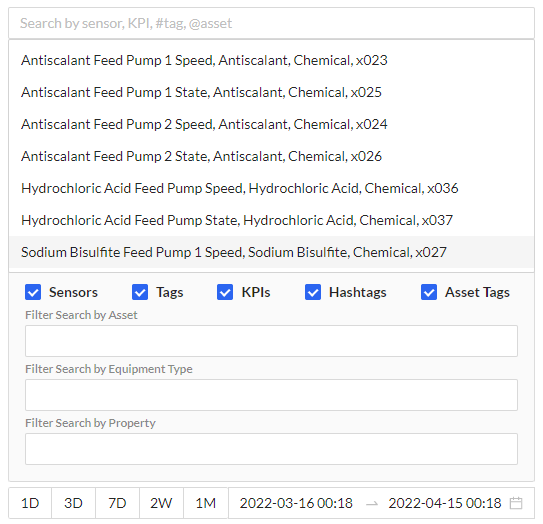
3. Search for assets that you wish to examine by adding an “@” at the front of your keyword. You can also bring up a list of asset tags to search by adding a “#” at the front of your keyword. Multiple sensors and KPIs can be added to the KPI selection as well.
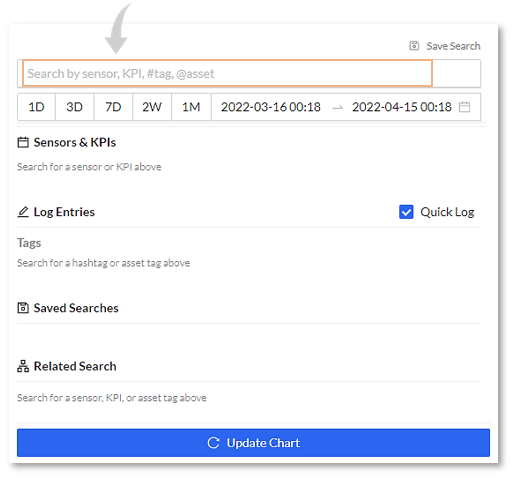
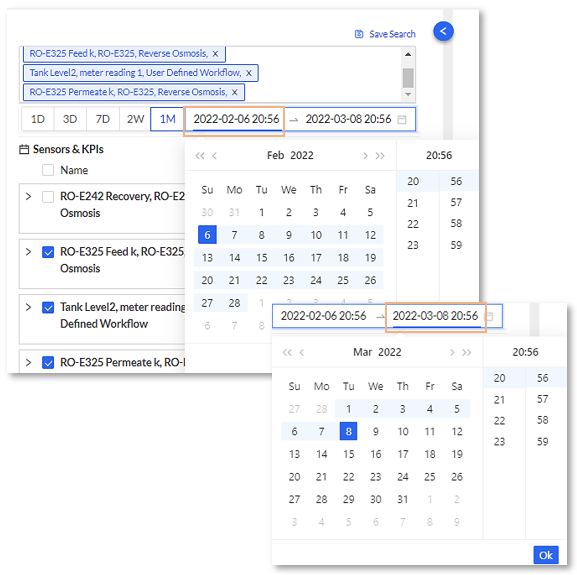
4. You can select the date range and time interval of the data you want to be displayed on the chart by using the date range selector.
- for additional information on Sensors/KPIs click here 🖱.
How to set up interactive graph metrics and Y-axis:

1. Under the search bar, select the sensors/KPIs that you wish to view. This will allow you to see which sensors and KPIs will be included in the interactive graph.
2. Once you have chosen your sensors/KPIs, select the Y-axis labelled sliders to indicate which side of the graph a KPI’s Y-axis scale will appear. This is useful when you have a lot of data on the screen to analyze. In this example some of the graph scales are stacked on the left , while others are stacked on the right side of the graph window. Click "Update Chart" found at the bottom of the page to generate your interactive graph.
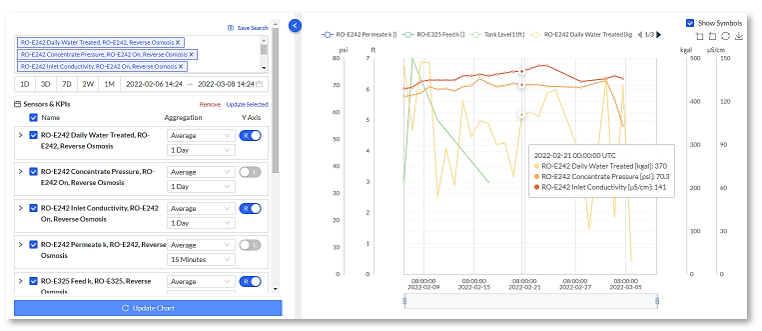
3. You can run you mouse cursor over the generated graph where a popup will appear. You can zoom in to specific dates/times to analyze the areas of most interest to you.
4. If a graph is not generated when you select "Update Chart", then this most likely means there is little to no data for the date range selected, or the sensor/KPI data is out of range.
- for additional information on Y-Axis Setup click here 🖱.
- for additional information on The Interactive page click here 🖱.
Lets review what was covered before moving on to the next section
- We learned how to search for assets (sensors) that we wanted to examine
- Selected a date range for performing our root cause analysis
- Selected sensors/KPIs and set Aggregation & Y Axis for creating a graph to analyze
The Notifications Page
The platform evaluates KPIs and Alert settings and will trigger alerts as thresholds are exceeded. Alerts are a great way to keep staff informed when systems or processes exceed limits.
What's covered in this section of the tutorial:
- How to create an Alert with the Alert Builder function
- How to edit/delete an existing Alert
- How to Acknowledge a triggered Alert
How to Create Alerts:
Here we will create an Alert, set when it triggers, what level of importance it will report at, and recommended action to be taken.
1. Login to the platform and select the desired plant from the Home page.
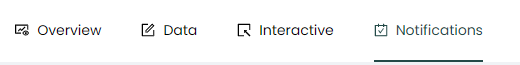
2. Select the "Notifications" page from the top main menu.
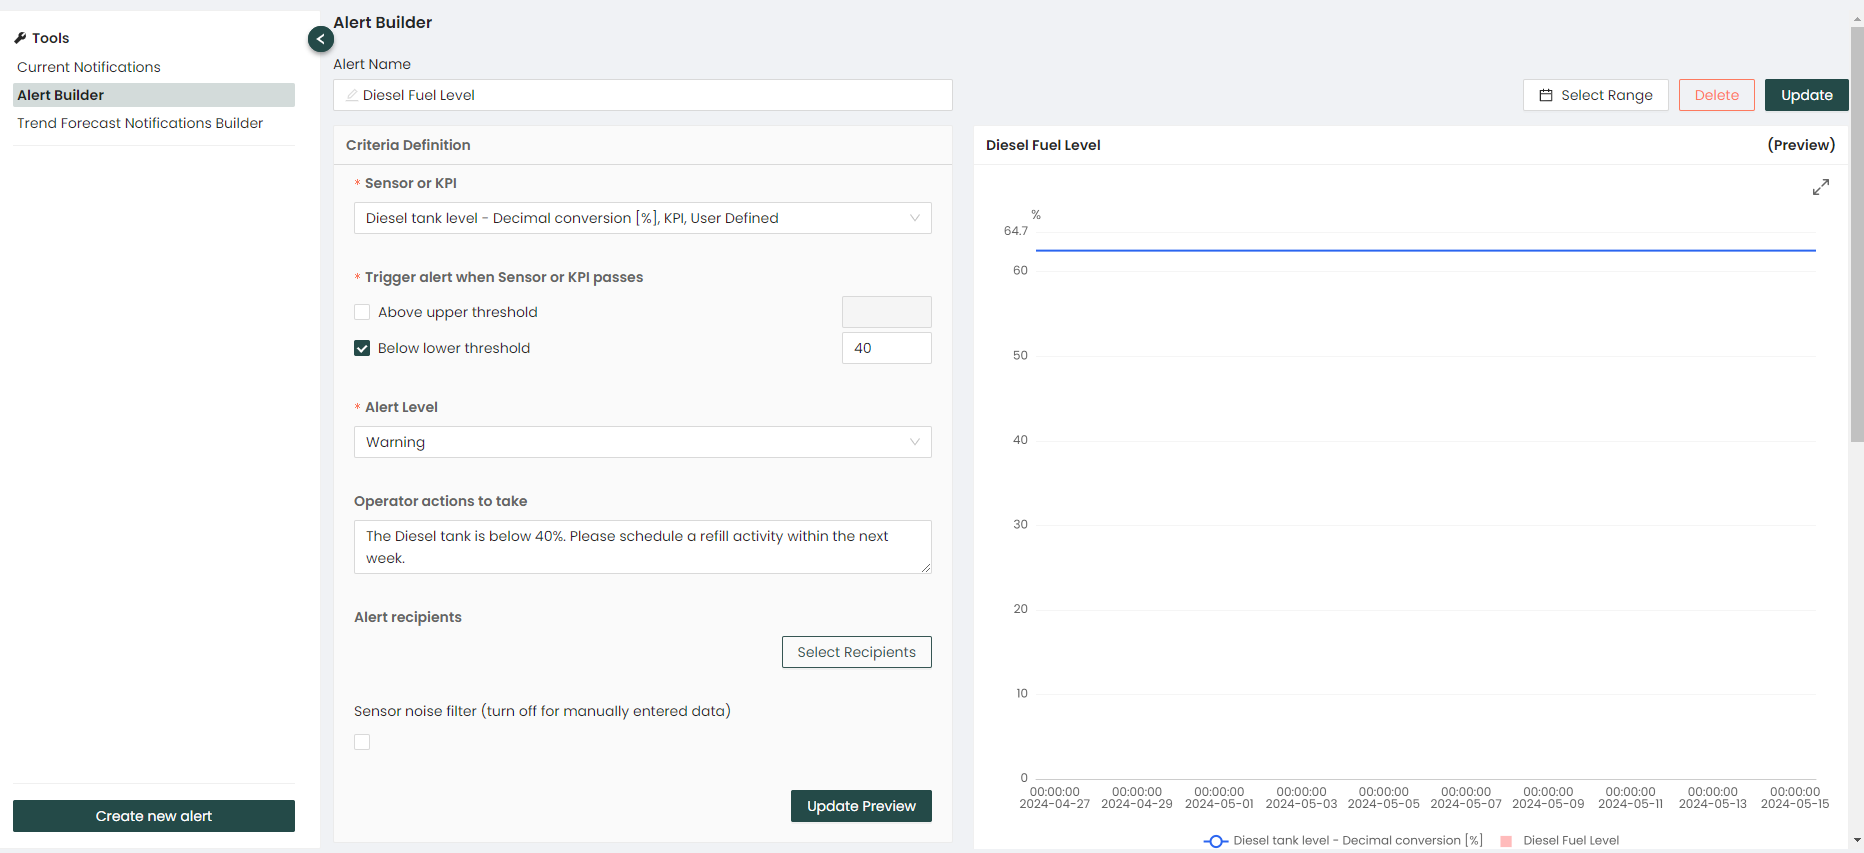
3. From the Notifications page, select the Alert Builder tool from the left side menu, then find and select the Sensor or KPI from the dropdown menu that would trigger the alert you want to create.
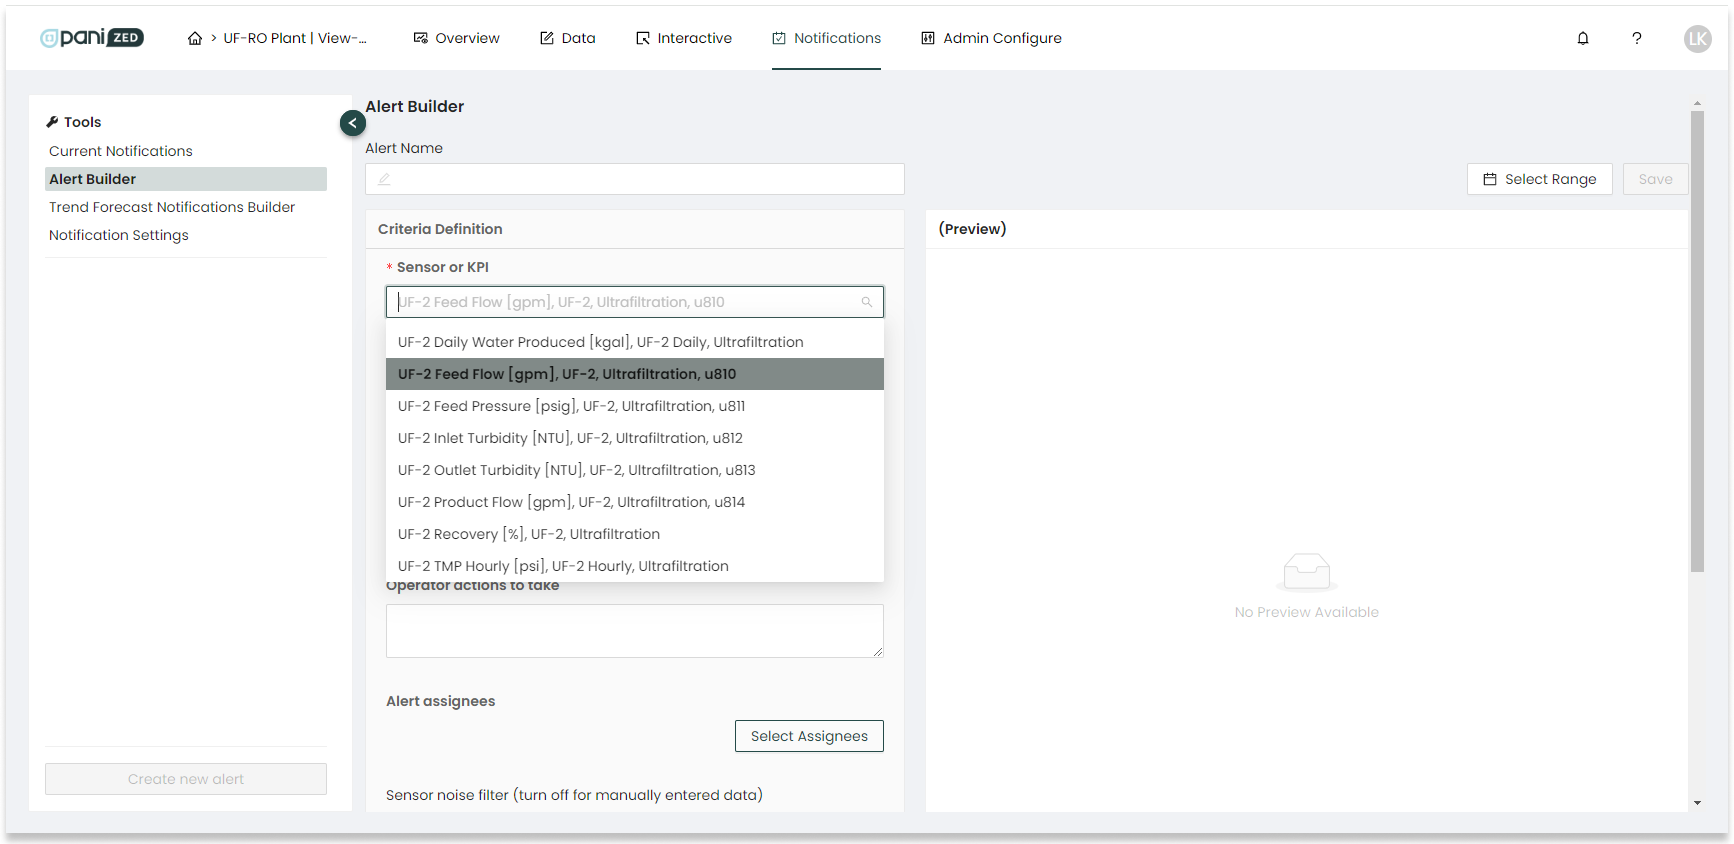
4. Fill in the necessary details - give your alert a name, set the high and low threshold for triggering the alert, the severity level, and a note of what action to take by those who receive the alert (this can include contacting a manager or a link to a Standard Operating Procedure that Pani can host).
5. Assign the people you want to receive this alert. The "Select Assignees" button will provide a pop-up with a list of e-mail recipients to choose from, to receive an email notification if the alert is triggered. Select the "Save Assignees" button to finalize adding these recipients.
6. With all the information added, save the alert with the "Save" button in the top right corner of the page. After an alert is saved, it will appear in a table at the bottom of the screen.
For additional information on Creating Alerts click here 🖱.
How to Edit/Delete alerts:
1. You can edit/delete an alert by selecting the desired alert from the bottom of the page. This will allow you to make changes to the alert then click Update. If you want to delete an alert, click "Delete".
For additional information on Editing/Deleting Alerts click here 🖱.
How to Acknowledge an Alert:
Here are a few additional tips on where to find alerts, as well as ways of responding to and Acknowledging a triggered alert.
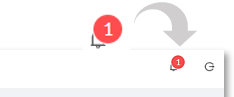
1. When an Alert triggers, it generates a notification that is indicated by the number of notifications in a red circle on the alarm bell icon in the upper right of the platform, making any new or acquired alerts easy to see at a glance from any page of the platform.
2. Clicking on the alarm bell will show a truncated form of the alert(s) triggered, and you can select from there to be taken to the Notifications page to view in full. When viewing on the Notifications page, you can get details, acknowledge, and configure as needed.
For example, the triggered Alert will indicate why it triggered. In this case "Daily Production is out of bounds". And what the recommended course of action is; again in this case "Contact operations manager for further instructions" or "See SOP at the following link."
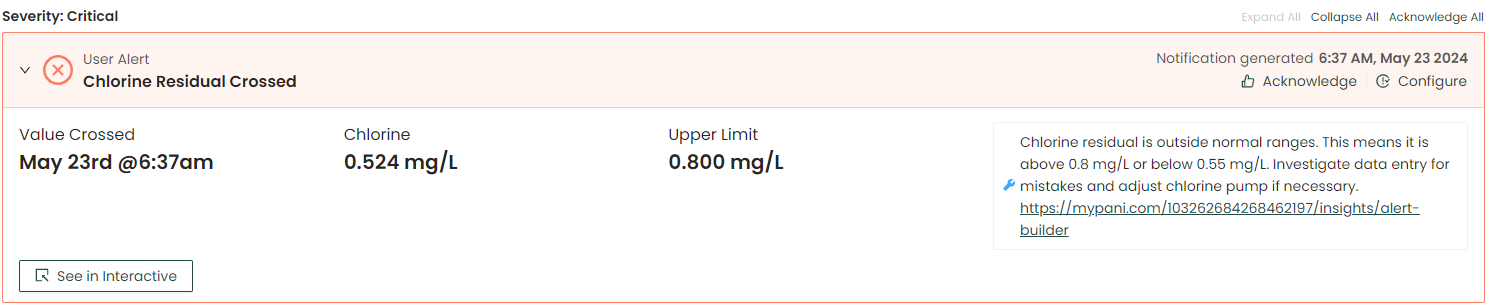
3. Acknowledge or Configure the alert as needed. In a perfect world, an Alert would be Acknowledged by the first person that receives it. When this is not possible, creating a Quick Log can be helpful to communicate to the rest of the team that the alert has been seen and how it is being handled - for example, is in the process of investigation by a particular person, and waiting to clear out after the investigation is complete, ensuring the team is clear and resources utilized wisely.
Lets review what was covered in this section
- We created an alert including the various parameters to set to trigger that alert
- We learned how to edit and delete an existing alert
- We learned how to Acknowledge an Alert, and the importance of its acknowledgement

