

|
|
The Pani ZED™ Forecasting feature is a service prediction tool that informs the user and the operations team when service is required for a particular asset, such as membranes in a Reverse Osmosis (RO) skid. This includes membrane cleaning and replacement, and helps to recommend the Time-to-Service (TTS).
Forecasting predicts the number of days until a specific threshold is reached indicating the need for servicing. It also informs the user of consequences if servicing is not performed. This allows the operations team to balance potential conflicts between servicing an asset and lost production.
Asset Menu
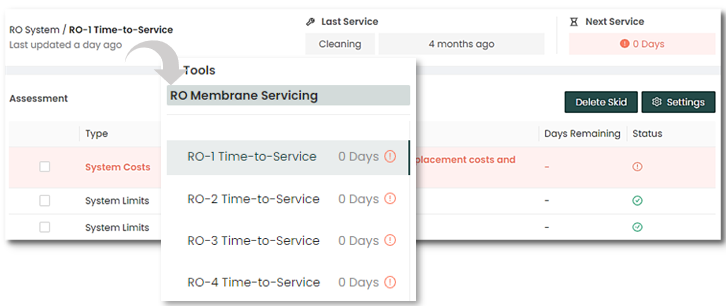
The left menu (as shown below) displays each of the RO trains in the treatment facility.
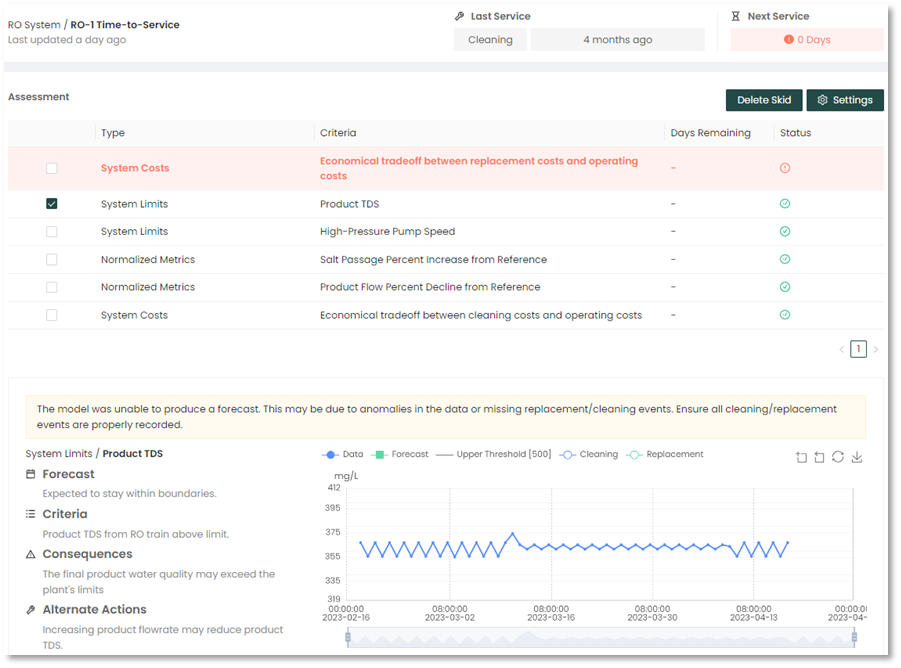
Once an RO train is selected (in this case, RO-1 Time-To-Service), the top of the screen will show the type of membrane service and how many days ago it was performed. It will also indicate when the next membrane service is due.
Forecasting Details
Each one of these events can be chosen by toggling the box on the left of the forecast. The user can then scroll to the bottom of the screen to find more details of the forecast.
The graph below includes a trend line estimating when a particular threshold will cross the performance threshold and a membrane servicing will be required. It also provides alternative actions if the user decides not to proceed with the servicing.
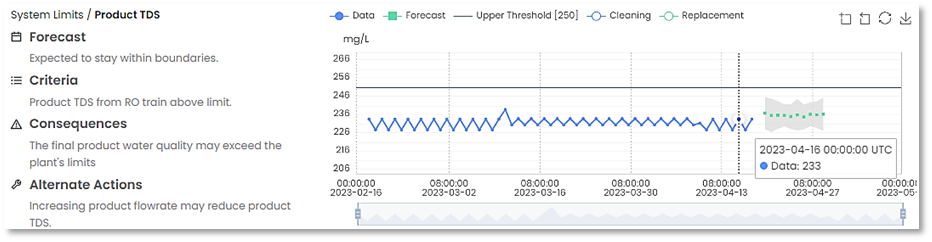
Moving the mouse cursor over the graph, displays the actual readings for points on the graph. Using the scroll wheel allows you to zoom in or out details of the selected point on the graph.
Some graphs display icons that when performing a cursor mouse over on the selected area, allows you to select zoom, back, restore, or save.
![]()
|
|
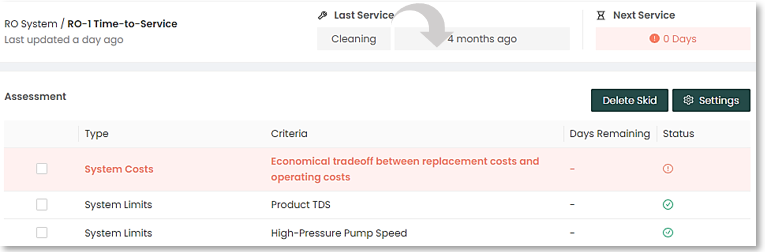
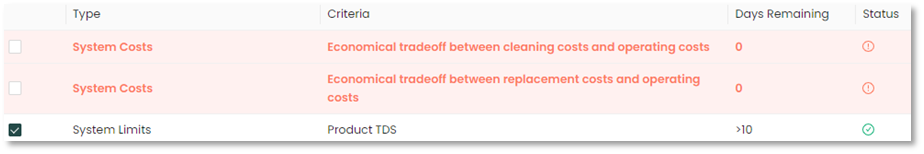
Customize Forecasts
The user has the option to set up and customize an assessment for a forecasting analysis. This includes thresholds and date ranges.
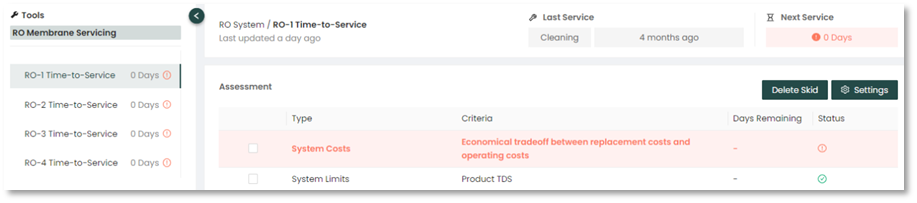
On the “Assessment” screen in the image above, different criteria will be colored either red, yellow, or uncolored. Each color is set to a specific quantity of days prior to the event, this quantity of days can be changed by the user.
- Red: event requires immediate attention or is due today.
- Yellow: event requires attention soon and resources should be planned accordingly.
- Uncolored: event should be on the radar but does not require any current preparation.
The following outlines the steps for customizing the forecast events:
1. Click the Settings button ![]() in the top right corner of the Assessment display.
in the top right corner of the Assessment display.
- If this button is greyed out (not active), then your user permissions may restrict this, so contact your company's Pani Zed admin.
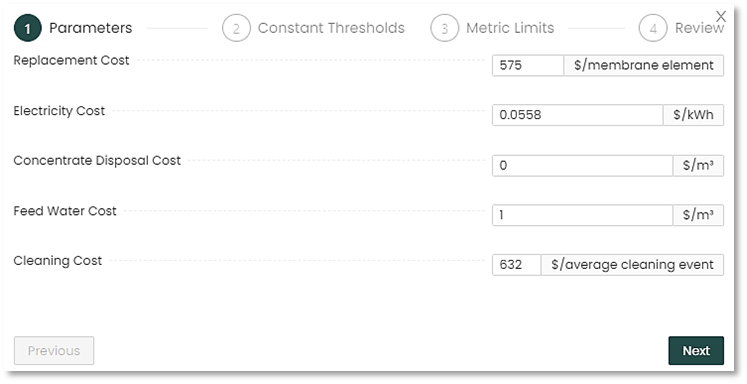
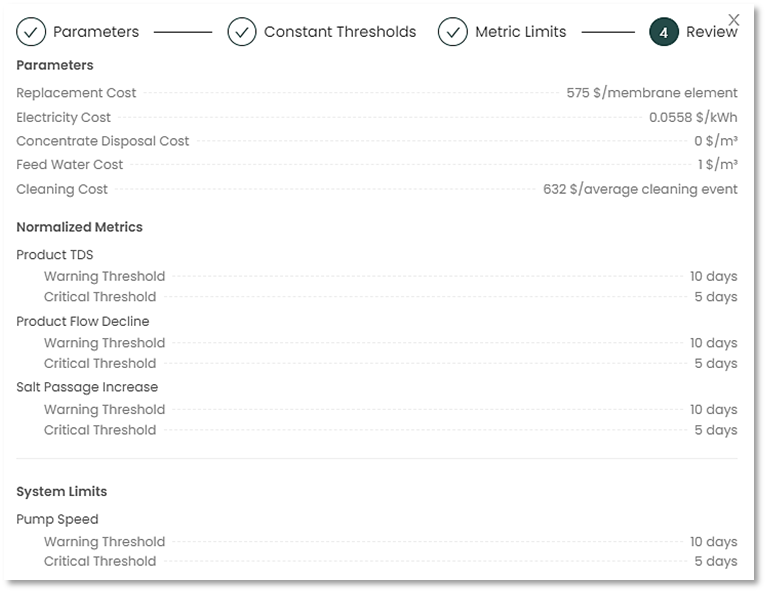
2. In the new settings window, adjust the membrane service costs.
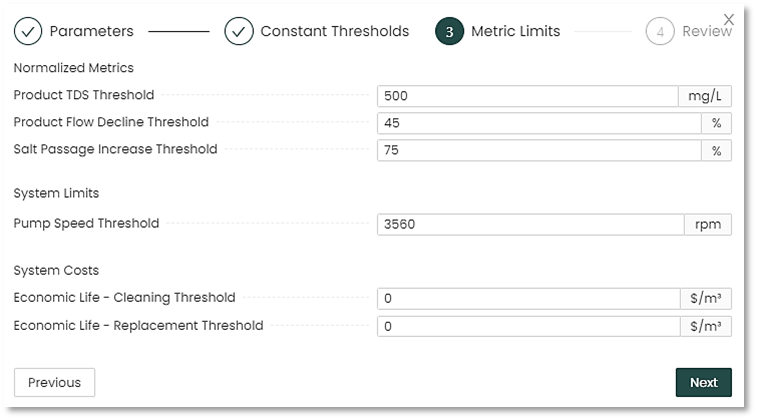
3. Next, you can adjust the thresholds of different metrics.
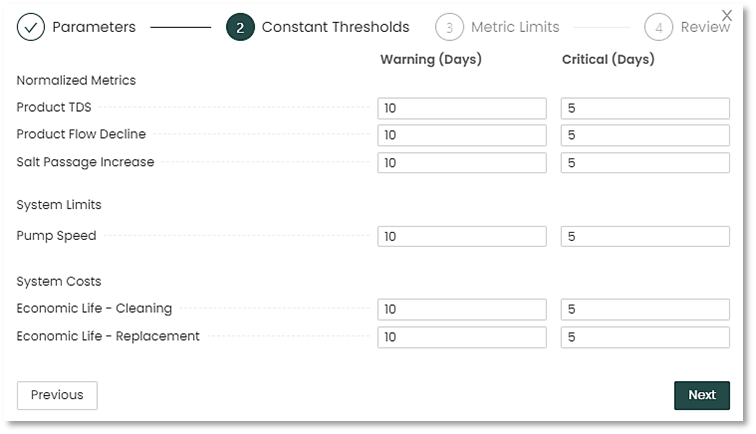
4. Third, you can change or adjust threshold values of the different metrics, for example if a new pump is installed that has a higher speed threshold.
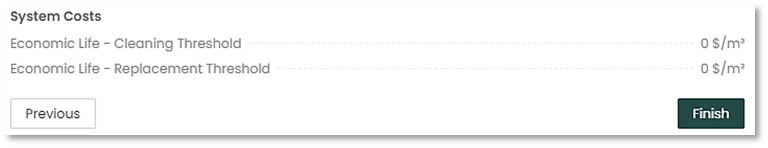
5. Finally, review the entries and/or updates for accuracy before completing the change.
6. Once the review is completed and approved, click the “Finish” button to apply the changes.
| Depending on the extent of the changes, it may take a few minutes for the system to calculate and implement these changes to the revised Forecasting. | 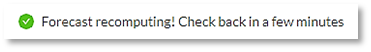 |

